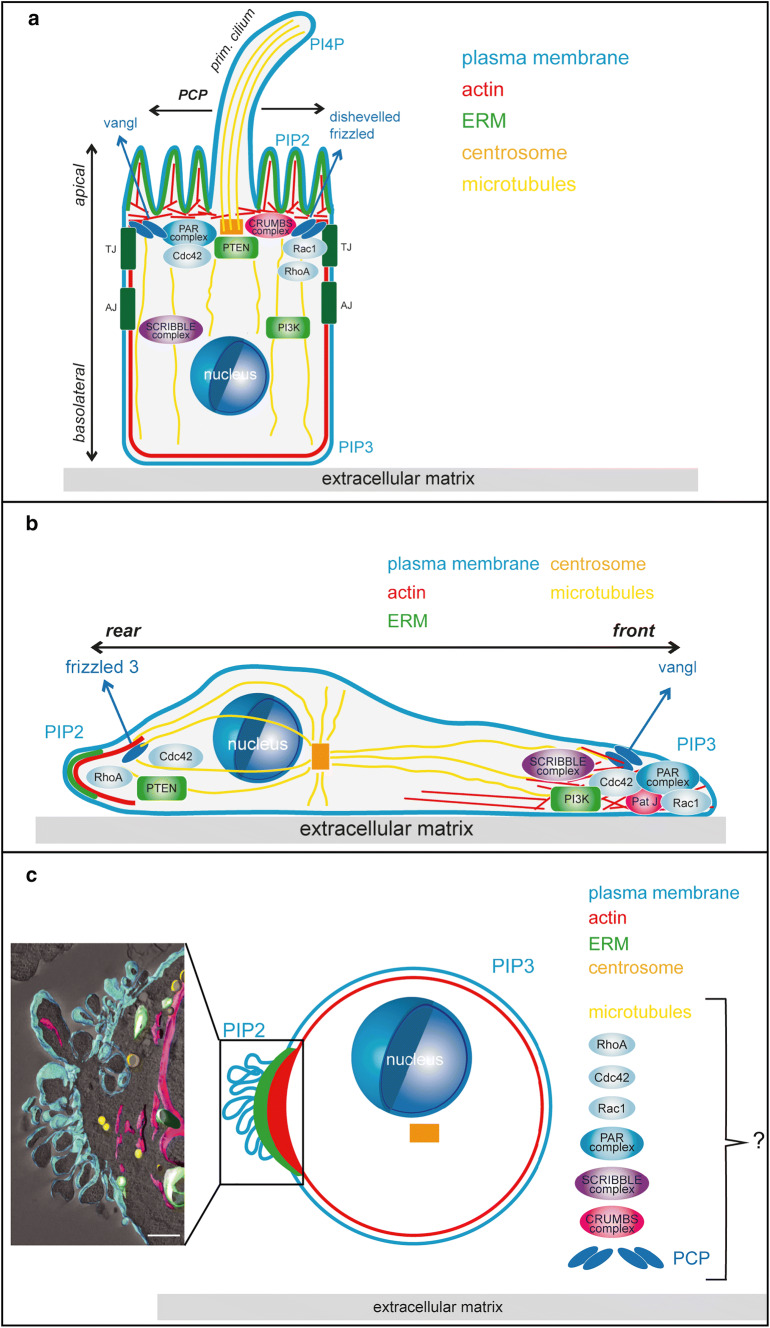
Fig. 1.
Polarisation states of tumour cells. The illustrations depict the localisation of some of the main polarity regulating modules in an epithelial cell displaying apical–basal polarity and planar cell polarity (PCP) (a), a migrating cell displaying front–rear polarity (b) or a cell in liquid phase displaying single-cell polarity (c). The inset in c shows a tomogram of the pole of an SkMel2 cell in suspension, adapted from [20], showing plasma membrane (cyan), ER and nuclear envelope (magenta), mitochondria (green) and lipid droplets (yellow). Scale bar 1 μm. While the molecules sustaining the different polarised phenotypes are the same in the different types of polarity, their localisation and interconnections differ. For details see main text. TJ tight junction, AJ adherens junction, PI3K phosphoinositide-3-kinase, PIP2 phosphatidylinositol 4,5 bisphosphate, PIP3 phosphatidylinositol 3,4,5 trisphosphate

