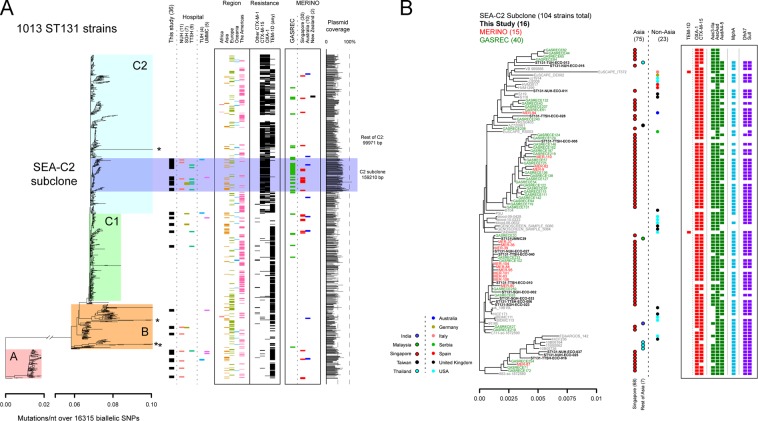
Figure 2.
Phylogenomic analysis of ST131 strains (with removal of recombination). (A) Overview of all ST131 strains analyzed in this study. The tree on the left is an approximately maximum-likelihood tree, with mutations indicated on the x-axis at the bottom. Colored boxes indicate different subsets of the ST131 strains. From left to right, bars indicate the new strains contributed by this study (black boxes), the hospital from which the strains in this study were obtained (colored boxes below the “Hospital” label), the WHO region from which the strain was isolated (if available), resistance gene predictions for selected beta-lactamase genes, and the strains included from the GASREC and MERINO studies (with country of origin for MERINO strains). At the far right, the bar graph represents the percentage of the pTTSH16 plasmid that is covered by the assembly for each strain (based on blastn). Average plasmid coverage values for selected subsets of strains are indicated. (B) Expanded view of the SEA-C2 clone. Strains from this study, MERINO, or GASREC are indicated by font size and color; gray labels indicate other public data sets. Country of origin is indicated by the colored circles, with strains from Asia on the left with black outlines and strains from non-Asian areas on the right. Resistance gene predictions for each strain are indicated on the right with colored boxes; each class of resistance gene is in a separate color, with the gene indicated at the top.

