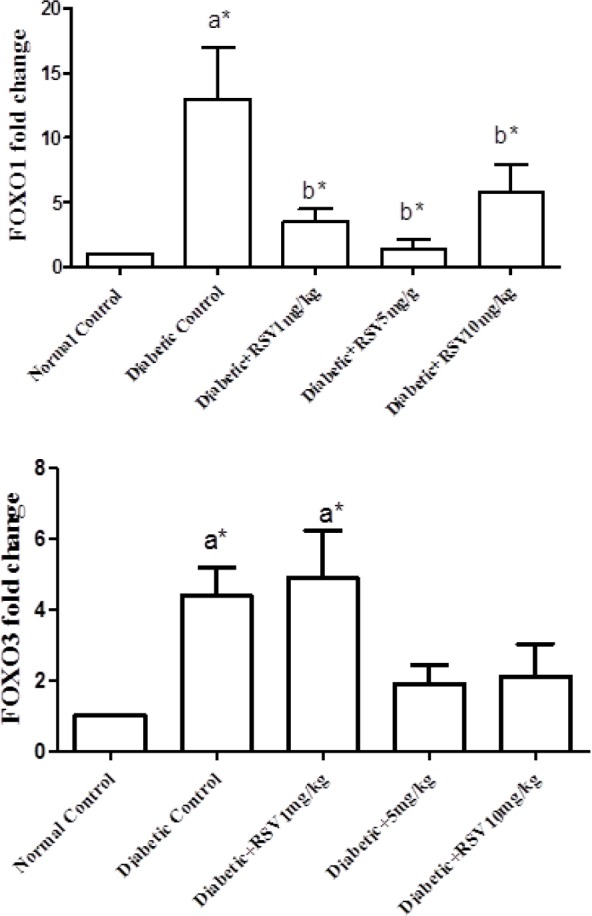
Fig 2.

Effect of different doses of RSV on FOXO1 (A) and FOXO3a (B) genes expression in adipose tissue of the studied groups. Normal control: healthy control group; Diabetic Control: diabetic untreated group; Diabetic+RSV 1 mg/kg: diabetic group treated with 1 mg/kg.bw/day of RSV; Diabetic+RSV 5 mg/kg: diabetic group treated with 5 mg/kg.bw/day of RSV; Diabetic+RSV 10 mg/kg: diabetic group treated with 10 mg/kg.bw/day of RSV. a: compared with normal control group; b: compared with diabetic control group. *: P <0.05
