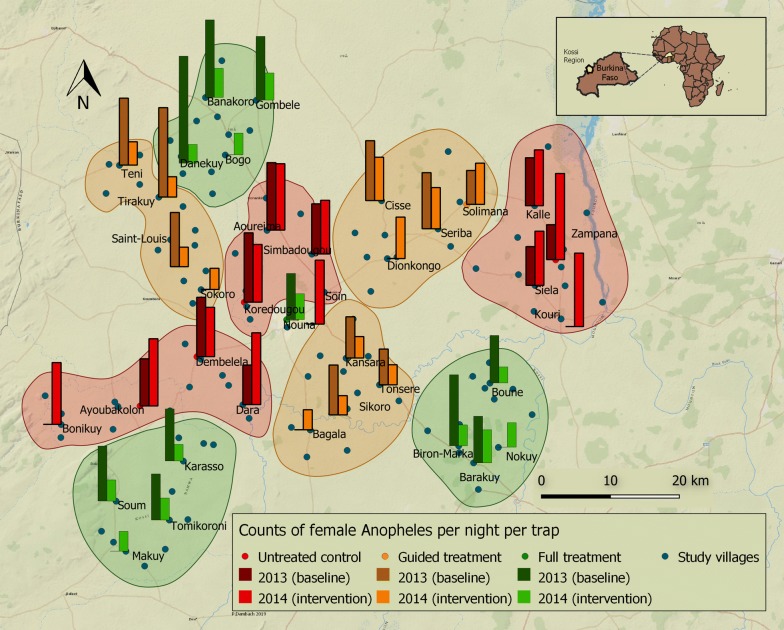
Fig. 2.
Study villages are shown with blue dots; bars indicate mosquito density in villages where mosquito captures took place. Bars show the average numbers of female Anopheles mosquitoes captured per trap per night indoors and outdoors using CDC light traps in September and October 2013 and 2014. Colours indicate treatment choice (Green = full treatment, orange = selective treatment, red = untreated control group). Closed lines encompass clusters of villages receiving the same treatment. In 2014, 9 additional villages were added to the mosquito collections

