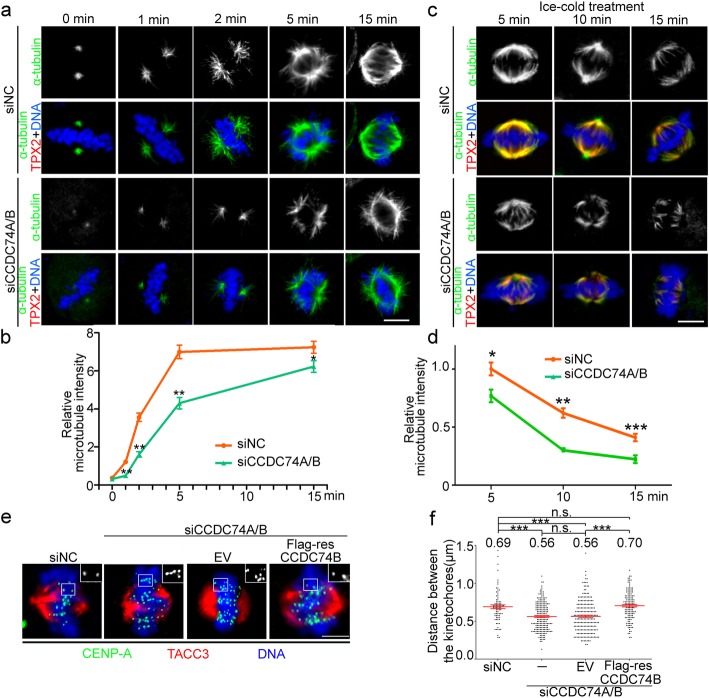
Fig. 3.
CCDC74A/B stabilize K-fibers. a Immunofluorescence of α-tubulin (green) in negative control (siNC) and CCDC74A/B-siRNA (siCCDC74A/B) HeLa cells after chilling 1 h on ice and rewarmed at 37 °C at the indicated time points. DNA was stained with DAPI (blue). Scale bar, 10 μm. b The microtubule signals from a were measured. Signals from siNC cells were normalized to 1.0 (three independent experiments). c Immunofluorescence of α-tubulin (green) and TPX2 (red) in siNC and siCCDC74A/B HeLa cells after ice chilling for the indicated time spans. DNA was stained with DAPI (blue). Scale bar, 10 μm. d Relative microtubule intensity from c (three independent experiments). e Immunofluorescence of CENP-A (green) and TACC3 (red) in siNC, siCCDC74A/B, or siCCDC74A/B together with empty vector (EV) or with siRNA-resistant Flag-CCDC74B (Flag-resCCDC74B) transfecting HeLa cells. DNA was stained with DAPI (blue). Scale bar, 5 μm. f Distances between kinetochores from e (three independent experiments). In b and d, data are mean ± SEM (unpaired two-tailed Student’s t test, ***P < 0.001, **P < 0.01, *P < 0.05). In f, data are mean ± SEM (one-way ANOVA test, ***P < 0.001; n.s., not significant)

