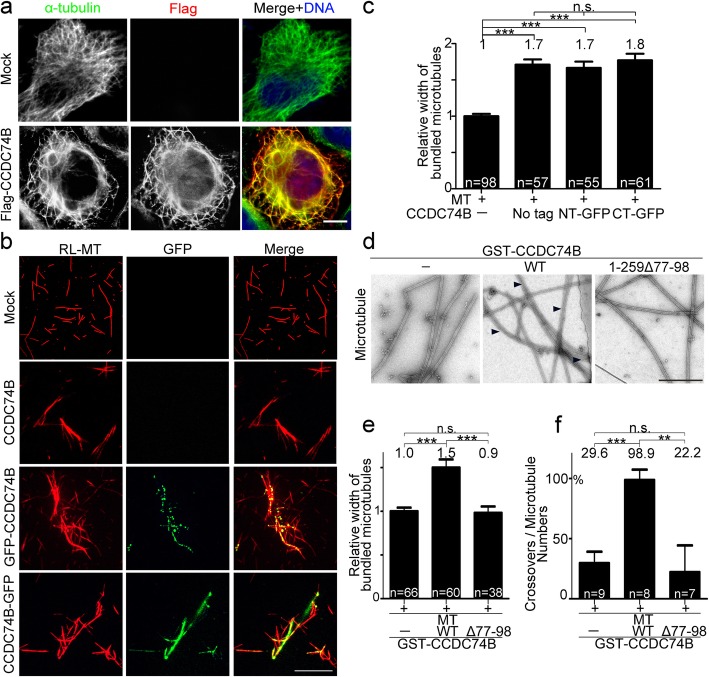
Fig. 5.
CCDC74A/B bundle microtubules in vivo and in vitro. a Immunofluorescence of Flag (red) and α-tubulin (green) in HeLa cells transfecting with or without Flag-CCDC74B for 24 h. DNA was stained blue with DAPI. Scale bar, 5 μm. b Wild-field images of purified CCDC74B, GFP-CCDC74B (green) or CCDC74B-GFP (green) incubated with rhodamine-labeled, and taxol-stabilized microtubules (RL-MT, red) (1 μM). Scale bar, 2 μm. c Statistical analysis of width of bundled microtubules in b. The mock group was normalized to 1.0. NT-GFP, N-terminal-tagged GFP, GFP-CCDC74B. CT-GFP, C-terminal-tagged GFP, CCDC74B-GFP (three independent experiments). d Negative-stained images of taxol-stabilized microtubules only (left), together with GST-CCDC74B wild-type (WT) (middle), or truncation mutant 1-259Δ77-98 (right) examined by electron microscopy. Scale bar, 500 nm. Black arrowheads indicate the bundled microtubule. e Statistical analysis of width of bundled microtubules in d. The mock group was normalized to 1.0 (three independent experiments). f Statistical analysis of crossovers/microtubules ratios in d (three independent experiments). In c, e, and f, data are mean ± SEM (one-way ANOVA test, ***P < 0.001, **P < 0.01; n.s., not significant)

