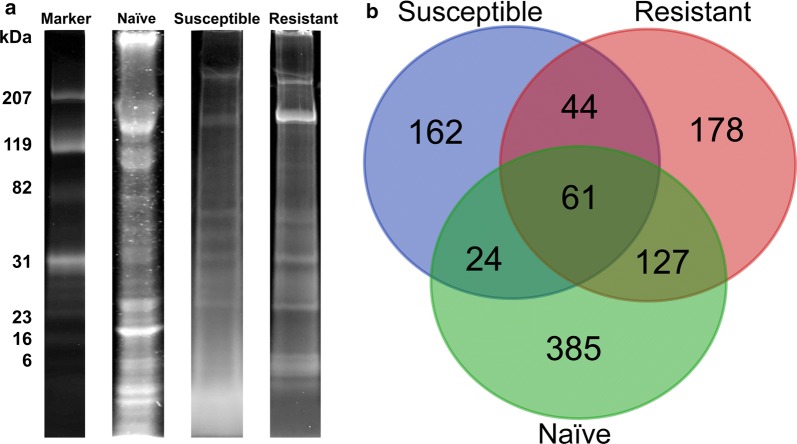
Fig. 3.
Comparison of 1D SDS-PAGE (with Coomassie stain) images and the number of ESPs identified by LC-MS/MS. a Representative gel images of three experimental conditions and molecular weight marker (kDa). b Venn diagram showing number of ESPs identified in SCW from naïve, infected and resistant B. glabrata

