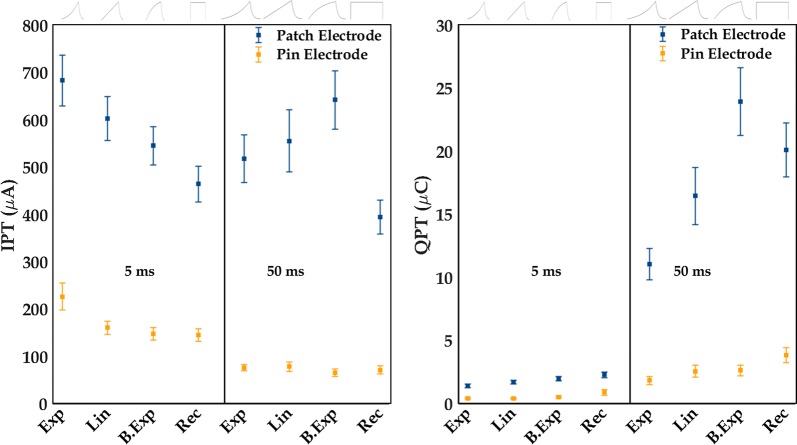
Fig. 2.
Perception thresholds are shown (mean ± standard error) as current (IPT) on the left and as charge (QPT) on the right. IPT and QPT are shown for all pulse forms of 5- and 50 ms durations for the pin- and the patch electrodes. Exp exponential increase, Lin linear increase, B.Exp bounded exponential, Rec rectangular. Blue line = patch electrode, orange line = pin electrode. The pulse shapes are illustrated above the figure

