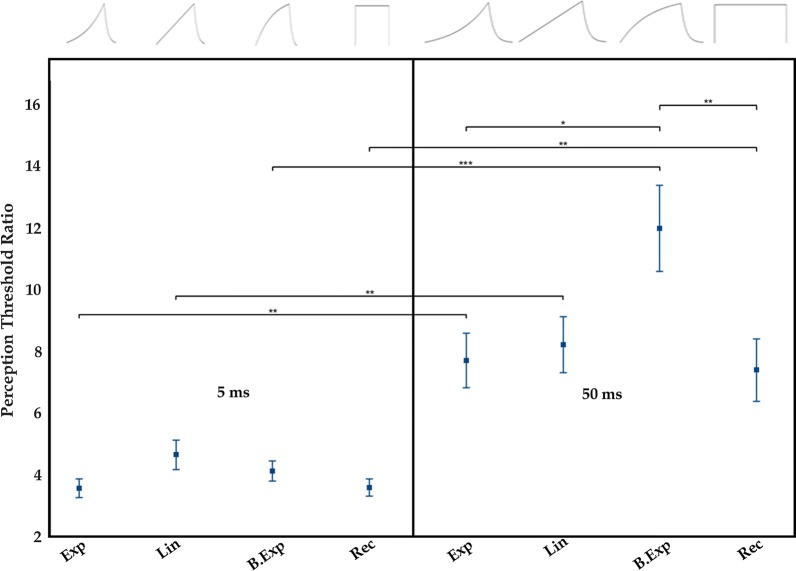
Fig. 3.
PT-ratios (mean ± standard error) between the patch- and the pin electrodes are shown for all pulse shapes and durations. Exp exponential increase, Lin linear increase, B.Exp bounded exponential, Rec rectangular. Statistical significant differences with Sidak multiple comparisons are included: *, **, and *** indicate p < 0.05, p < 0.01, and p < 0.001, respectively

