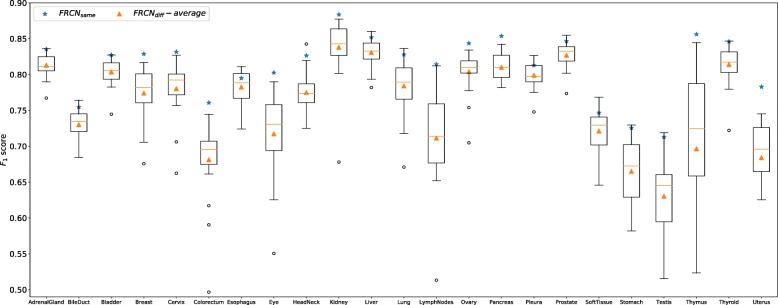
Fig. 10.
The F1 score of FRCN on different data. Blue stars denote models trained and tested on the same datasets (FRCNsame), i.e., images from the same types of organs across different patients. The boxes represent models trained on one dataset but tested on another and the orange triangles denote the average performance (FRCNdiff-average) over these models

