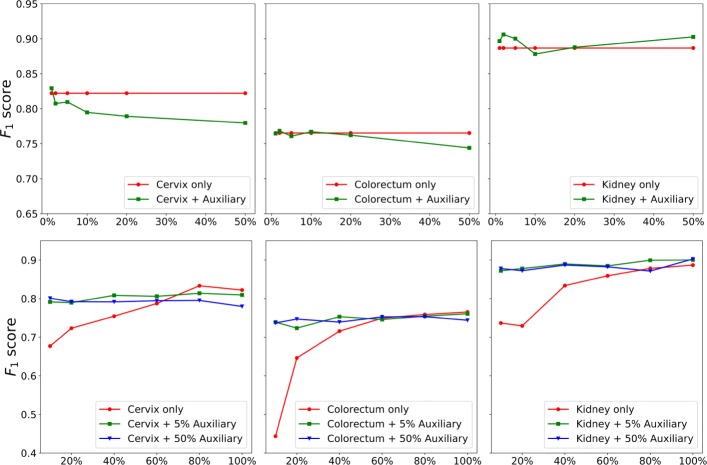
Fig. 6.
Comparison between MicroNet learning with and without auxiliary data. For each target dateset (i.e., cervix, colorectum or kidney) in the top row, all its training data are mixed with different numbers of auxiliary training data (x-axis represents the percentage of auxiliary training data). In the bottom row, a fixed number (i.e., 5% and 50%) of auxiliary training data are used to mix with different numbers of target training data, as shown in the x-axis

