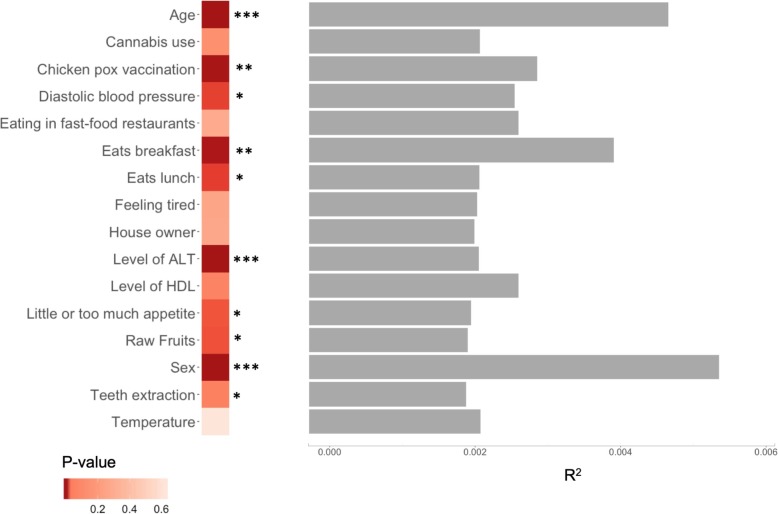
Fig. 4.
Association of non-genetic variables with Bray-Curtis index. Significant variables from the univariate test and their R2 values (right-hand side). Heatmap represents the PERMANOVA’s p values from the multivariable test, and the asterisks denote the statistical significance (***p < 0.001, **p < 0.01, *p < 0.05). The results for other β-diversity metrics are available in Additional file 2: Table S5

