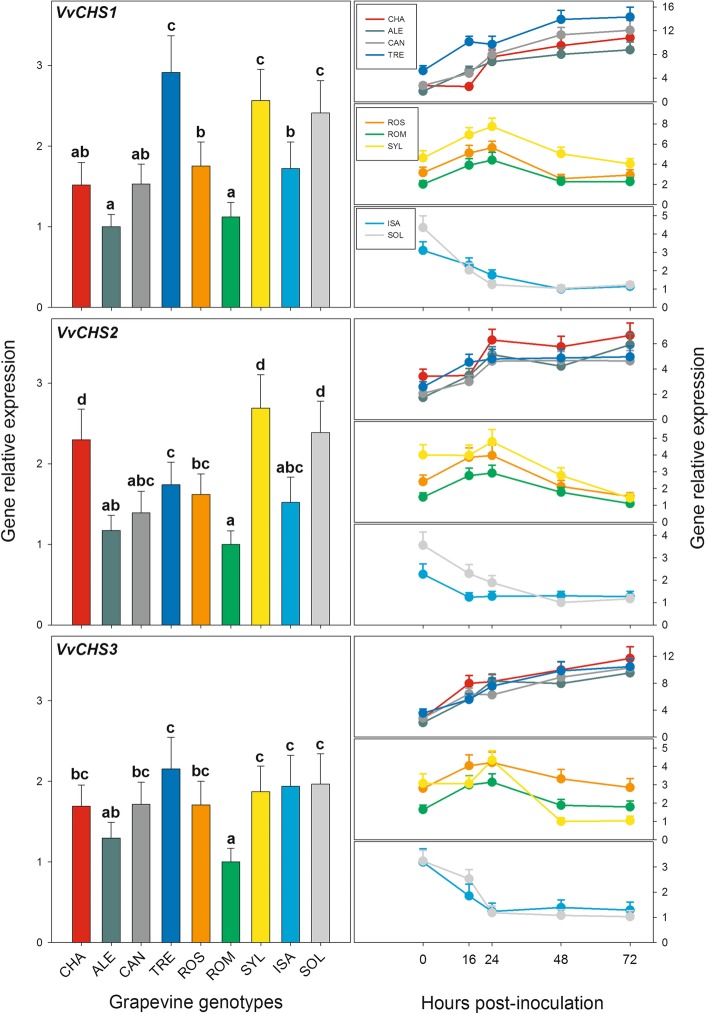
Fig. 7.
Relative expression levels of the Vitis vinifera chalcone synthase genes (VvCHS) in the leaves of the nine grapevine genotypes of Fig. 1 collected either before inoculation with Plasmopara viticola (left panels) or up to 72 h after inoculation (right panels). For each gene, relative expression levels were calculated by setting a value of 1 for the lowest value among the nine genotypes in each of the five time points considered. Normalization and sample replication as in Fig. 3. For the left panels, different letters denote significant differences according to the Tukey’s test (p ≤ 0.01). In the right panels, statistical evaluation of the differences among the nine grapevine genotypes and among the five sampling times is reported in Additional file 3: Table S8. Grapevine genotypes: CHA = Chasselas, ALE = Aleatico, CAN=Canaiolo nero, TRE = Trebbiano toscano, ROS = Rossetto, ROM = Romanesco, SYL = accession of V. vinifera subsp. sylvestris, ISA = Isabella, SOL = Solaris

