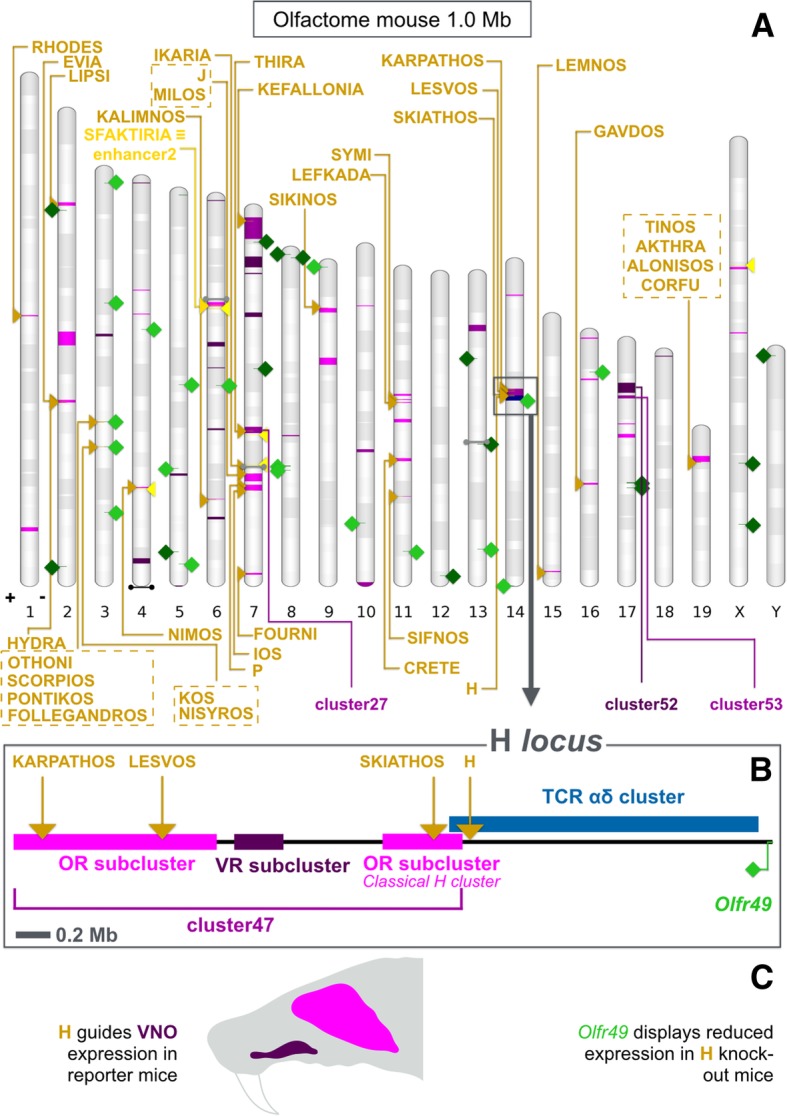
Fig. 3.

The mouse olfactome. a Chromosome chart for the mouse olfactome 1 Mb threshold. Magenta intervals mark locations for clusters composed by three or more genes: light magenta for odorant receptor (OR) and/or trace amine-associated receptor-only clusters, dark magenta for pure vomeronasal receptor (VR) and/or formyl peptide receptor clusters, mid magenta for those containing members from both groups. Names for a few notable clusters are explicitly indicated. Miniclusters are reported as dumbbells, in light gray if composed solely by OR genes, black if made up by just VR genes, and dark gray when mixed (with the same meaning as for regular clusters). Solitary genes are rendered as green squares, depicted on the genomic strand that contains their sense strand; more specifically, dark green indicates solitary VR genes, light green is used for solitary OR genes. Previously discovered/hypothesized (dark yellow) or newly predicted (light yellow) elements are reported as triangles (on plus strand, +, unless otherwise required due to graphical constrains). Known enhancer names are noted down. Names for our candidate elements are not explicitly reported, but these are simply numbered according to chromosomal location. Putative enhancer2 overlaps extensively with Sfaktiria. Near to H, a blue interval corresponds to the αδ T-cell receptor (TCR) cluster. Chromosome bands represent Giemsa staining. b Detail on the H locus (magnified from panel A, shadowed box). Considering OR and VR genes together (here as cluster47) causes two OR groups (one being the classical H cluster) to be united by a bridge of VR genes; on the right, the aforementioned TCR cluster is followed by the solitary OR gene Olfr49. c H locus as a possible functional olfactome unit. While an effect of H on VR gene regulation awaits to be proven, H drives vomeronasal organ (VNO) expression in transgenic reporter mouse strains. The solitary gene Olfr49 has been reported as mildly affected by H deletion. Based on its genomic isolation, this effect has been considered to be a mere consequence of strain variations between H-deficient and control mice
