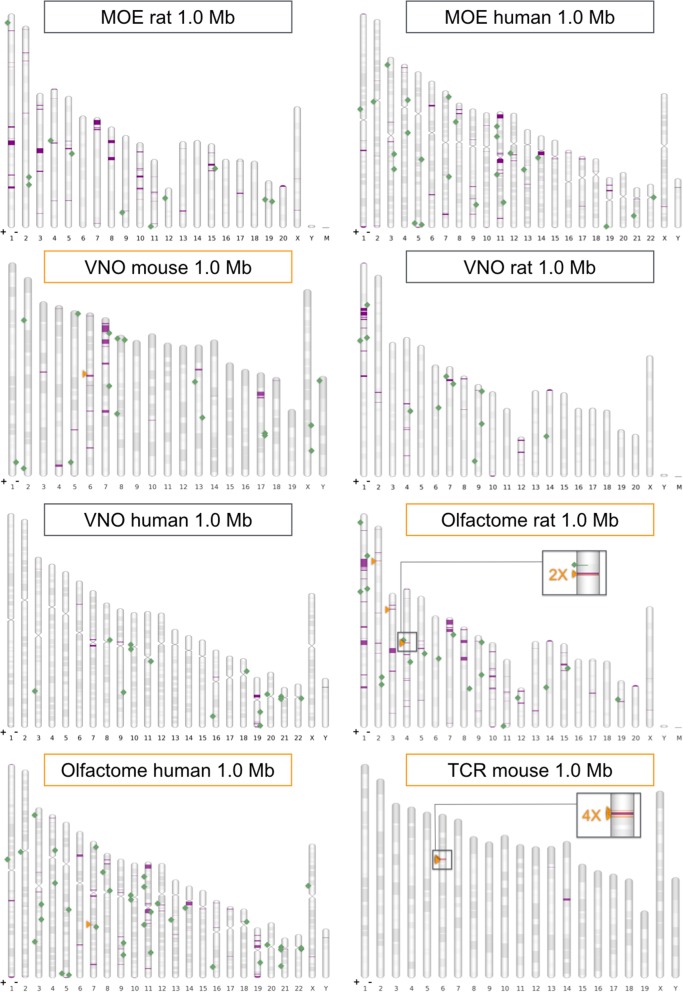
Fig. 4.
Genomic architecture for groups of clustered receptor genes. Selected chromosome charts mapping clusters (magenta intervals) and solitary genes (green squares); list types are main olfactory epithelium (MOE), vomeronasal organ (VNO), olfactome or T-cell receptor (TCR) genes. Solitary genes are depicted on their sense strand (on genomic plus or minus filament, + or -). For those lists used for element prediction (their title line is boxed in orange) we also report candidate enhancers (as orange triangles, always on genomic plus strand). When putative elements are found to be in close proximity, (shadowed) magnified boxes are provided. Chromosome bands represent Giemsa staining

