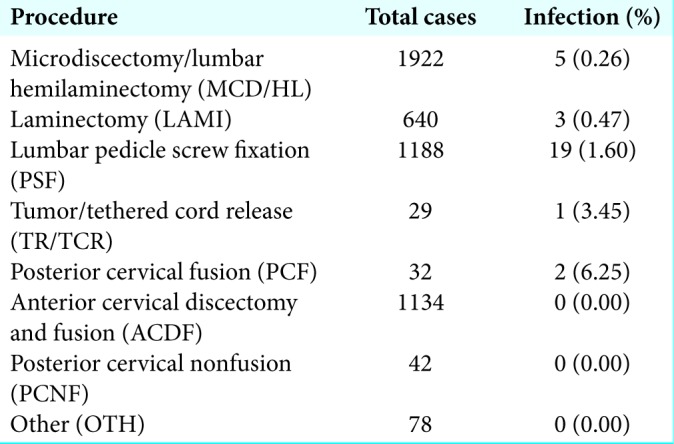
Table 2:
A numerical representation of the infection rate for each category of surgical procedure performed over the period of 2010-2015 in this single surgeon practice.

A numerical representation of the infection rate for each category of surgical procedure performed over the period of 2010-2015 in this single surgeon practice.
