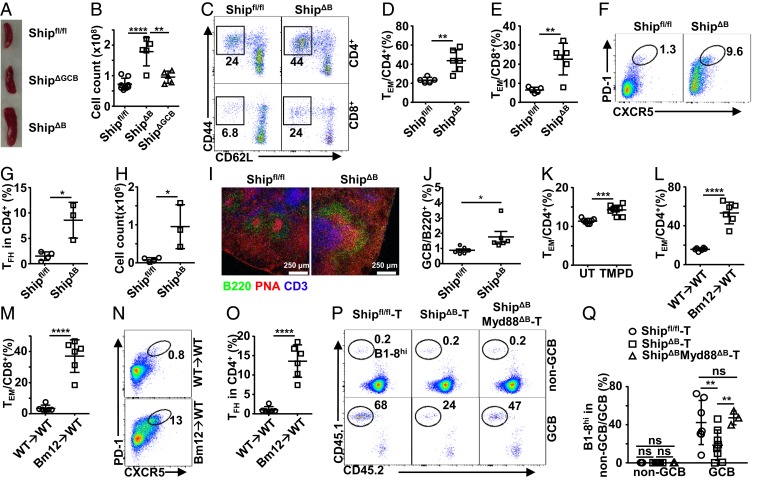
Fig. 2.
Aberrant T-cell profile is responsible for impaired GC selection in lupus mice. (A and B) Representative image (A) and cell counts (B) of spleens from Shipfl/fl, ShipΔB, and ShipΔGCB mice. (C–E) Representative FACS profile (C) and bar graph (D and E) showing the percentage of CD44+CD62L− effector/memory cells (TEM) among CD4+ (D) and CD8+ (E) T cells in the spleen of Shipfl/fl and ShipΔB mice. (F–H) Representative FACS profile (F) and bar graph (G and H) showing the percentage (F and G) and absolute number (H) of TFH cells in the spleen of Shipfl/fl and ShipΔB mice analyzed 2 wk after NP-CGG immunization. (I) Immunofluorescence image of frozen sections of spleens from Shipfl/fl mice and ShipΔB mice analyzed 2 wk after NP-CGG immunization. (J) Percentage of GCB cells (PNA+CD95+) in total spleen B cells of Shipfl/fl or ShipΔB mice. (K–M) Percentage of TEM cells among CD4+ (K and L) or CD8+ (M) T cells in the spleen of TMPD-induced mice (K) and Bm12 cGVHD mice (L and M). (N and O) Representative FACS profile (N) and bar graph (O) showing the percentage of TFH cells in the spleen of Bm12 cGVHD mice 2 wk after NP-CGG immunization. (P and Q) Representative FACS profile (P) and bar graph (Q) showing the percentage of B1-8hi cells among non-GC or GC B cells in T cell-deficient mice (TCRβ−/−TCRδ−/−) transplanted with T cells isolated from Shipfl/fl, ShipΔB, or ShipΔBMyd88ΔB mice and then treated and analyzed as in Fig. 1A. Each symbol in the bar graphs represents an individual mouse. Bars represent means ± SD. ns, not significant; *P ≤ 0.05; **P ≤ 0.01; ***P ≤ 0.001; ****P ≤ 0.0001 (1-way ANOVA with Sidak’s multiple comparisons test [B]; unpaired 2-tailed t test [D, G, H, J–M, and O], 2-way ANOVA with Sidak’s multiple comparisons test [Q]). A representative of 2 (L–O) or 3 (A–K) independent experiments is shown. Q is summarized from 2 independent experiments with similar results.

