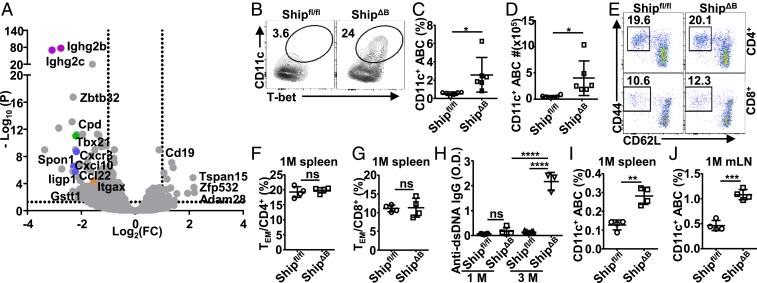
Fig. 3.
Excessive CD11c+Tbet+ ABCs precede aberrant T-cell activation. (A) Volcano plot showing genes expressed differentially (change in expression of over 2-fold) in B-lineage cells (sorted as B220+ and B220lowCD138hi) from Shipfl/fl mice relative to those from ShipΔB mice. (B–D) Frequency of CD11c+Tbet+ABCs among B220+CD19+CD43−CD93−CD23−CD21− cells (B), B220+CD19+ cells (C), and absolute cell number of CD11c+Tbet+ABC per spleen (D) of Shipfl/fl and ShipΔB mice (3 to ∼4 mo old). (E–G) Representative FACS profile (E) and bar graph (F and G) showing the percentage of CD44+CD62L− effector/memory cells (TEM) among CD4+ (E and F) and CD8+ (E and G) T cells in the spleen of 1-mo-old Shipfl/fl and ShipΔB mice. (H) Anti-dsDNA IgG autoantibody levels in the serum of Shipfl/fl and ShipΔB mice at the age of 1 or 3 mo. (I and J) Percentage of CD11c+ ABCs among B cells in the spleen (I) or mesenteric lymph node (mLN) (J) of 1-mo-old Shipfl/fl and ShipΔB mice. Each symbol in the bar graphs represents an individual mouse. Bars represent means ± SD. ns, not significant; *P ≤ 0.05; **P ≤ 0.01; ***P ≤ 0.001; ****P ≤ 0.0001 (unpaired 2-tailed t test [C, D, F, G, I, and J], 1-way ANOVA with Sidak’s multiple comparisons test [H]). A representative of 3 independent experiments is shown (B–J).

