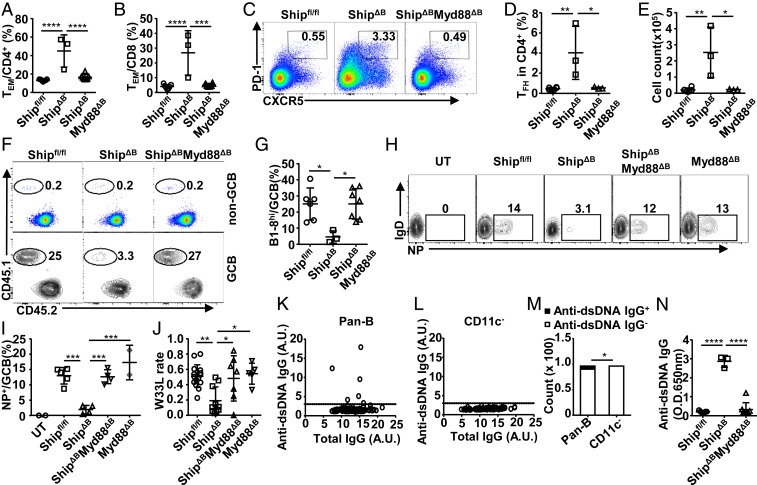
Fig. 6.
Inhibition of CD11c+Tbet+ ABC differentiation by ablating MyD88 prevents aberrant TFH differentiation and restores antigen-specific GC responses in ShipΔB mice. (A and B) The percentage of TEM cells among CD4+ (A) or CD8+ (B) T cells in the spleen of Shipfl/fl, ShipΔB, and ShipΔBMyd88ΔB mice. (C–E) Representative FACS profile (C) and bar graph (D and E) showing the percentage (C and D) and absolute number (E) of TFH cells in the spleen of Shipfl/fl, ShipΔB, and ShipΔBMyd88ΔB mice. (F and G) Representative FACS profile (F) and bar graph (G) showing the percentage of B1-8hi cells among non-GC and GC B cells in Shipfl/fl, ShipΔB, and ShipΔBMyd88ΔB mice treated and analyzed as in Fig. 1A. (H and I) Representative FACS profile (H) and bar graph (I) showing the percentage of NP-specific cells among GCB cells in untreated Shipfl/fl mice (UT) and Shipfl/fl, ShipΔB, ShipΔBMyd88ΔB, or Myd88ΔB mice immunized with NP-CGG 2 wk earlier. (J) W33L rate of splenic V186.2–Cg1 transcripts in mice treated as in H and I. (K and L) Anti-dsDNA IgG levels produced by ShipΔB splenic pan-B or CD11c− B cells cocultured with NB-21.2D9 feeder cells for 10 d (100 B cells per well), quantified as the ratio of signal to noise (S/N), with S/N ≥ 3 (marked by dotted lines) considered as anti-dsDNA IgG+ samples and otherwise anti-dsDNA IgG− samples. (M) Bar graph showing the number of anti-dsDNA IgG+ and anti-dsDNA IgG− samples in K and L. (N) Anti-dsDNA IgG autoantibody levels in ShipΔB and ShipΔBMyd88ΔB mice. Each symbol in the bar graphs represents an individual mouse. Bars represent means ± SD. *P ≤ 0.05; **P ≤ 0.01; ***P ≤ 0.001; ****P ≤ 0.0001 (1-way ANOVA with Sidak’s multiple comparisons test [A, B, D, E, G, I, J, and N], χ2 test [M]). A representative of 2 (K–M) or 3 independent experiments (A–I and N) is shown. J is summarized from multiple experiments with similar results.

