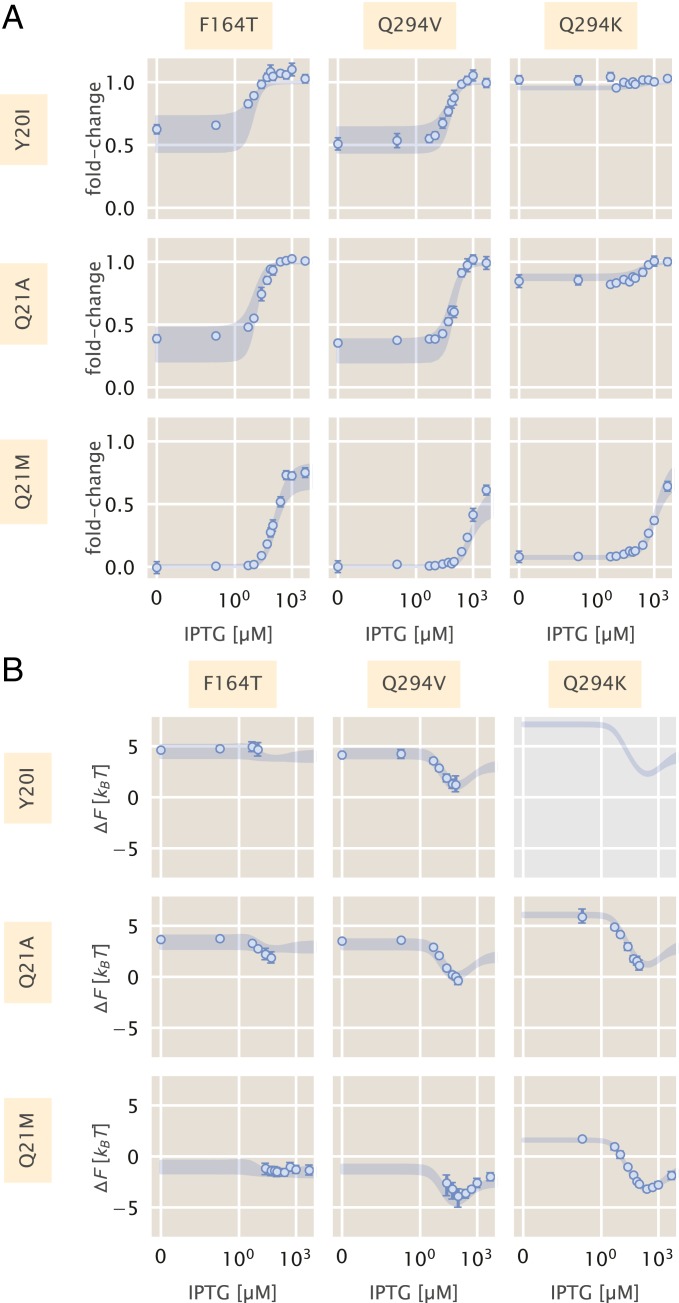
Fig. 5.
Induction and free-energy profiles of DNA binding and inducer binding double mutants. (A) Fold change in gene expression for each double mutant as a function of IPTG. Points and errors correspond to the mean and SE of 6–10 biological replicates. Where not visible, error bars are smaller than the corresponding marker. Shaded regions correspond to the 95% credible region of the prediction given knowledge of the single mutants. These were generated by drawing samples from the posterior distribution of the single DNA binding domain mutants and the joint probability distribution of , , and from the single inducer binding domain mutants. (B) The difference in free energy of each double mutant as a function of the reference free energy. Points and errors correspond to the median and bounds of the 95% credible region of the posterior distribution for the inferred . Shaded lines region are the predicted change in free energy, generated in the same manner as the shaded lines in A. All measurements were taken from a strain with 260 repressors per cell paired with a reporter with the native O2 LacI operator sequence. In all plots, the IPTG concentration is shown on a symmetric log axis with linear scaling between 0 and M and log scaling elsewhere.

