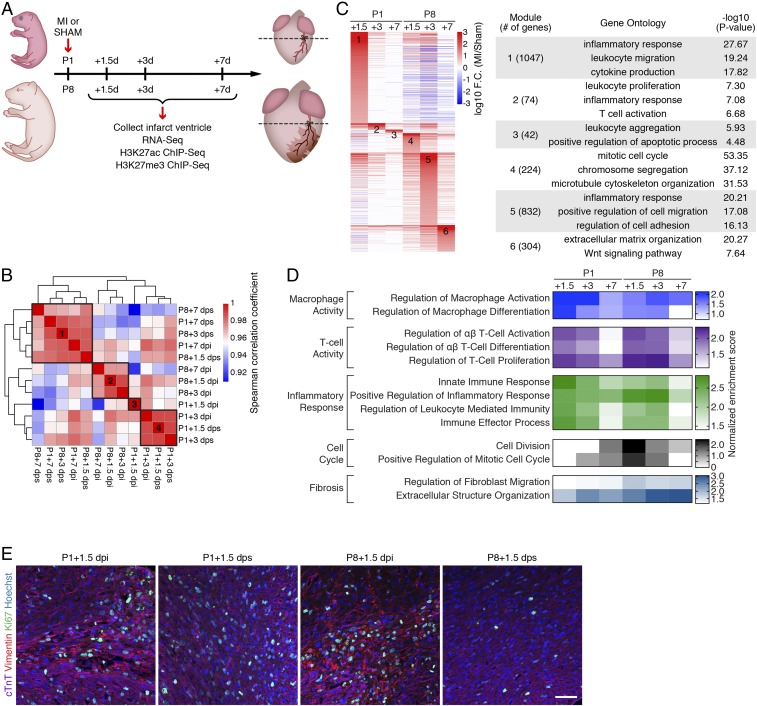
Fig. 1.
Transcriptomic analysis reveals distinct and stage-specific responses in regenerative and nonregenerative hearts. (A) Schematic illustration of experimental design and time points for sample collection. (B) Spearman correlation of RNA-Seq datasets showing the transcriptomic similarity among samples. Four distinct clusters were identified. (C, Left) Heatmap showing log10 (fold change [F.C.]) of genes induced by MI. Fold change was calculated by comparing the expression of each gene in MI samples over sham samples for each time point. MI-induced genes from each time point were merged and sorted into 6 groups based on the time point that has the highest fold change. (C, Right) Selected top enriched GO terms for MI-up genes from clusters 1 to 6. (D) Heatmap showing normalized enrichment scores of selected biological pathways that were significantly enriched from the GSEA. (E) Immunostaining of cTnT (purple), vimentin (red), and Ki67 (green) proteins on transverse sections at the level of suture from P1+1.5 dpi, P1+1.5 dps, P8+1.5 dpi, and P8+1.5 dps hearts. Nuclei were counterstained with Hoechst (blue). (Scale bar, 50 μm.)

