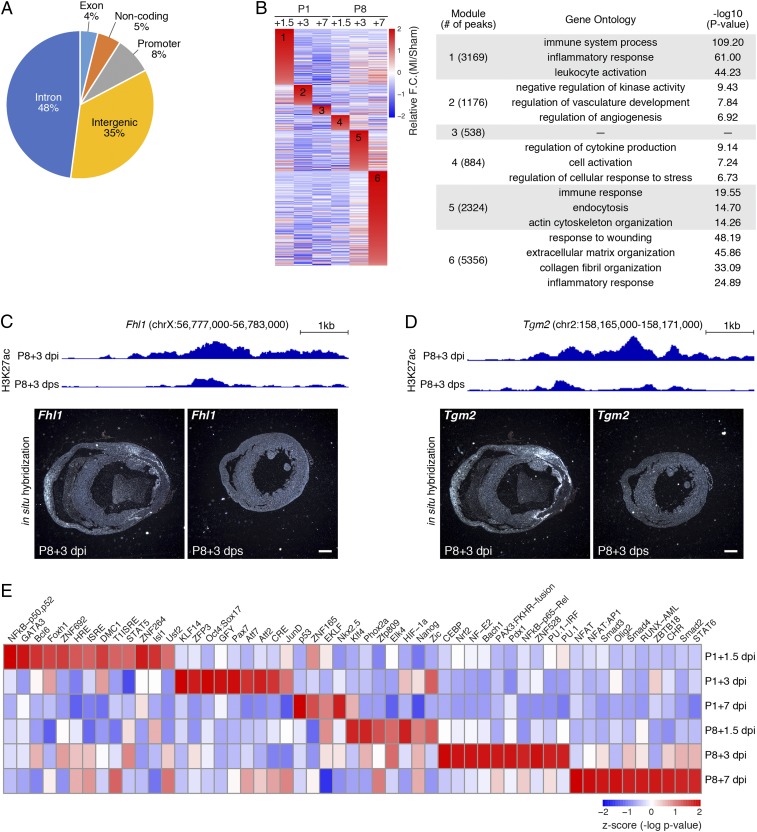
Fig. 2.
Injury-induced active chromatin regions revealed by H3K27ac ChIP-Seq. (A) Pie chart showing the genomic distribution of MI-gained H3K27ac peaks. (B, Left) Heatmap showing all MI-gained H3K27ac peaks, grouped and rearranged by the time point when they have the highest fold change compared with the sham control. (B, Right) Top GO terms associated with each group of peaks and the corresponding -log10 P value. (C, Upper) H3K27ac ChIP-Seq tracks showing the intronic peak activity in the Fhl1 gene locus at P8+3 dpi and P8+3 dps. (C, Lower) In situ hybridization images showing Fhl1 mRNA expression in transverse sections from P8+3 dpi and P8+3 dps hearts at the suture level. (Scale bar, 500 μm.) (D, Upper) H3K27ac ChIP-Seq tracks showing the Tgm2 enhancer peak activity at P8+3 dpi and P8+3 dps. (D, Lower) In situ hybridization images showing Tgm2 mRNA expression in transverse sections from P8+3 dpi and P8+3 dps hearts at the suture level. (Scale bar, 500 μm.) (E) Heatmap showing TF binding motifs preferentially enriched in MI-gained enhancers at each time point. For P8+3 dpi and P8+7 dpi, the top 10 enriched TF binding motifs are shown.

