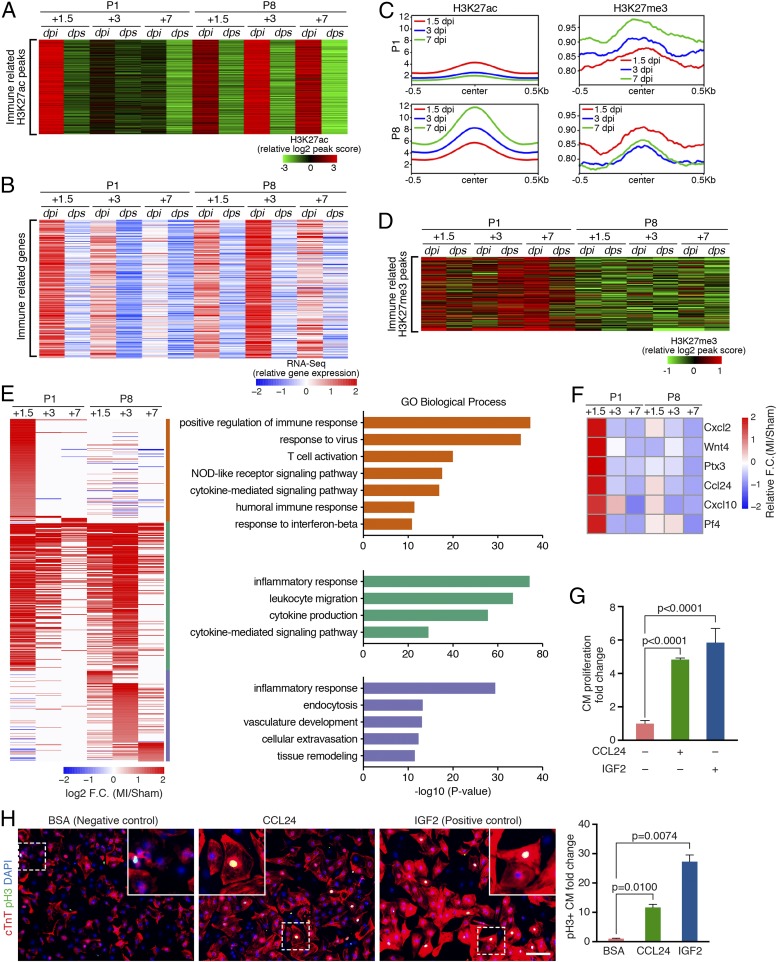
Fig. 3.
Different immune responses in regenerative and nonregenerative hearts. (A) Heatmap showing the peak scores of the H3K27ac peaks associated with immune response-related GO terms across all of the samples. (B) Heatmap showing expression levels of the nearest gene of each peak in A across all samples. (C) Metagene plots showing the normalized average signal (y axis) of H3K27ac (Left) and H3K27me3 (Right) at the immune-related peaks, identified in A, in P1 and P8 MI hearts at each time point following injury. An increase of the H3K27me3 signal was observed in the P1 regenerative heart at 1.5, 3, and 7 dpi, whereas decreased H3K27me3 signal was observed in the P8 nonregenerative heart after injury. The average signal of H3K27ac and H3K27me3 in the sham hearts at each time point is shown in SI Appendix, Fig. S3A. (D) Heatmap showing H3K27me3 signal at a cluster of MI-gained H3K27me3 peaks enriched for immune response-related GO terms. (E, Left) Heatmap showing log2 (fold change [F.C.]) of immune-related MI-up genes, which were further clustered into P1-enriched (orange bar, 156 genes), common (green bar, 221 genes), and P8-enriched (blue bar, 135 genes) clusters. (E, Right) Top enriched GO terms for P1-enriched, common, or P8-enriched immune-related gene clusters. (F) Heatmap showing z-score–transformed fold change of selected immune-related secreted factors at different time points post-MI. (G) CCL24 recombinant protein promotes CM proliferation. NRVMs were treated with 200 ng/mL bovine serum albumin (BSA) (negative control), 5 ng/mL CCL24, or 20 ng/mL IGF2 (positive control) recombinant proteins and pulse-labeled with EdU. The percentage of cTnT+/EdU+ double-positive cells was counted from immunofluorescent staining images (SI Appendix, Fig. S3E) to calculate the fold change of CM proliferation (n = 2 for each group). (H, Left) Immunofluorescent staining of cTnT (red) and pH3 (green) proteins on NRVMs treated with 200 ng/mL BSA (negative control), 5 ng/mL CCL24, or 20 ng/mL IGF2 (positive control) recombinant proteins (n = 2 for each group). Nuclei were counterstained with DAPI (blue). (Scale bar, 100 μm.) (H, Right) Fold change of the pH3+/cTnT+ double-positive cell proportion in CCL24- or IGF2-treated groups compared with BSA control was calculated.

