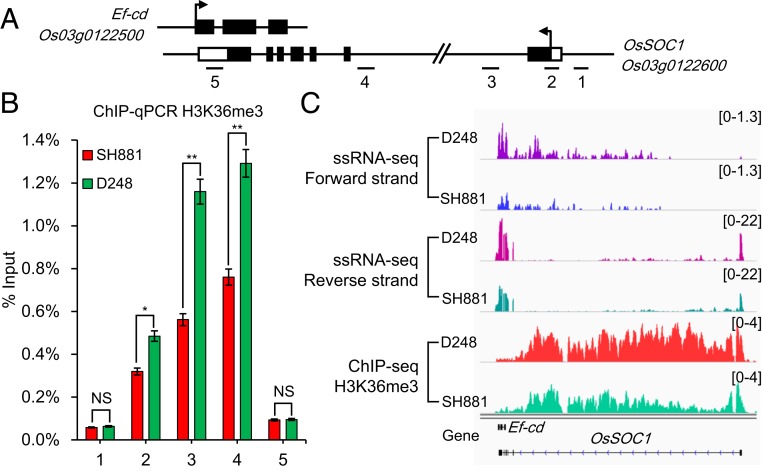
Fig. 3.
Analysis of H3K36me3 level and mRNA expression level. (A) Genomic structure of the Ef-cd and OsSOC1 locus. Black solid boxes indicate exons, and white boxes indicate untranslated regions. The number under each line corresponds to the number on the x axis in B for the H3K36me3 level in the region. (B) The results of ChIP-qPCR analysis to confirm H3K36me3-binding sites in SH881 and D248 surrounding the OsSOC1 locus. The percentage of ChIP’ed DNA to input DNA (% input) was detected using qPCR of ChIP samples. (C) Genomic tracks display gene expression change and H3K36me3 ChIP-seq change in D248 and SH881 surrounding the Ef-cd and OsSOC1 locus. The top 2 tracks are normalized Ef-cd intensity; the third and fourth tracks are normalized OsSOC1 gene intensity; the bottom 2 tracks are normalized genomic coverage of H3K36me3 in D248 and SH881. The Ef-cd and OsSOC1 genomic tracks are shown below the profiles. The P value was calculated using Student’s t test. *P < 0.05; **P < 0.01; NS, not significant.

