Fig. 2.
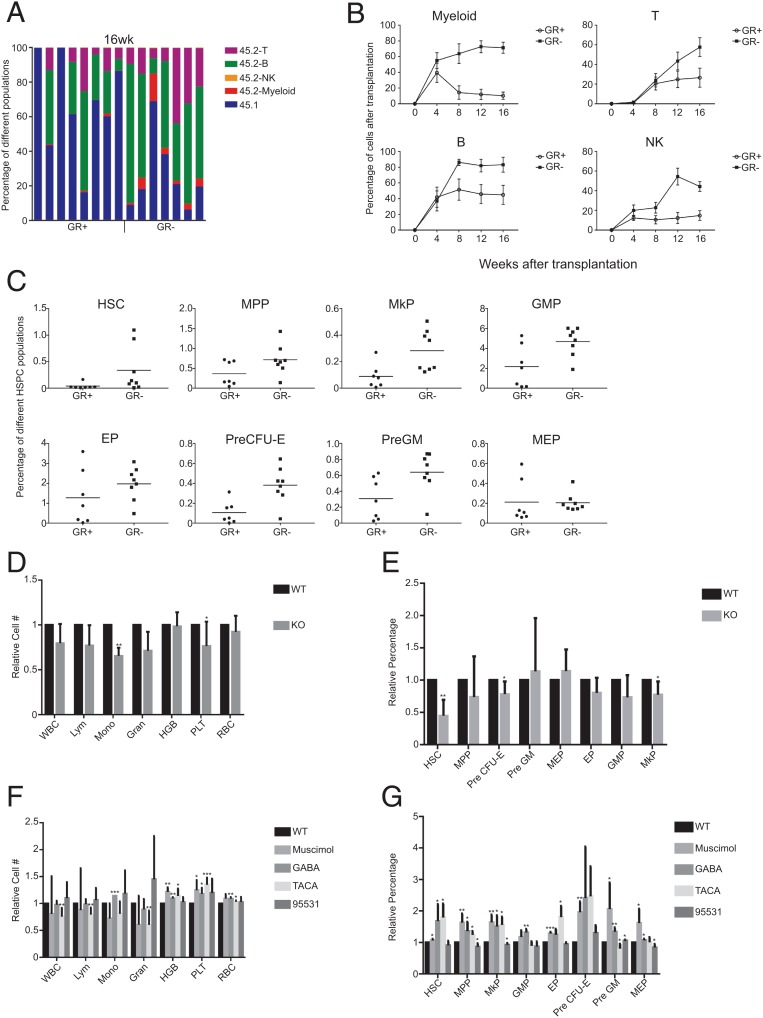
The effects of activation or inactivation of Gabrr1 on HSPC differentiation in mice. (A) Percentage of chimerism at 16 wk after transplanting GR+ HSCs (n = 8 mice) or GR− HSCs (n = 7 mice) into primary recipients. Each column represents an individual mouse. (B) Average donor lineage contributions of myeloid cells, B cells, T cells, and NK cells in primary transplants. Error bars denote SD. (C) Frequencies of HSPC populations from donor mice contributed in recipients. (D) The complete blood cell counts in peripheral blood of B6; 129S4-Gabrr1tm1Llu/J mice and their approximate control wild-type (WT) B6129SF2/J mice. For each cell count, the number from the WT mice was set to 1, and the number from Gabrr1 knockout (KO) mice was normalized to that. (E) The blood cell counts in peripheral blood of mice treated with agonists or antagonists of Gabrr1. WBC, white blood cell; Mono, monocyte; HGB, hemoglobin; Gran, granulocyte; Lym, lymphocyte; PLT, platelets. For each cell count, the number from the WT mice was set to 1, and the number from mice by other treatments was normalized to that. (F) Summary of mouse HSPCs from bone marrow of mice treated with agonists or antagonists of Gabrr1. For each HSPC population, the number from the WT mice was set to 1, and the number from mice by other treatments was normalized to that. Data shown in D, E, and F are mean ± SD of individual mice groups (n = 6 for each group) within the same experiment. *P < 0.05, **P < 0.01, ***P < 0.001.

