Fig. 3.
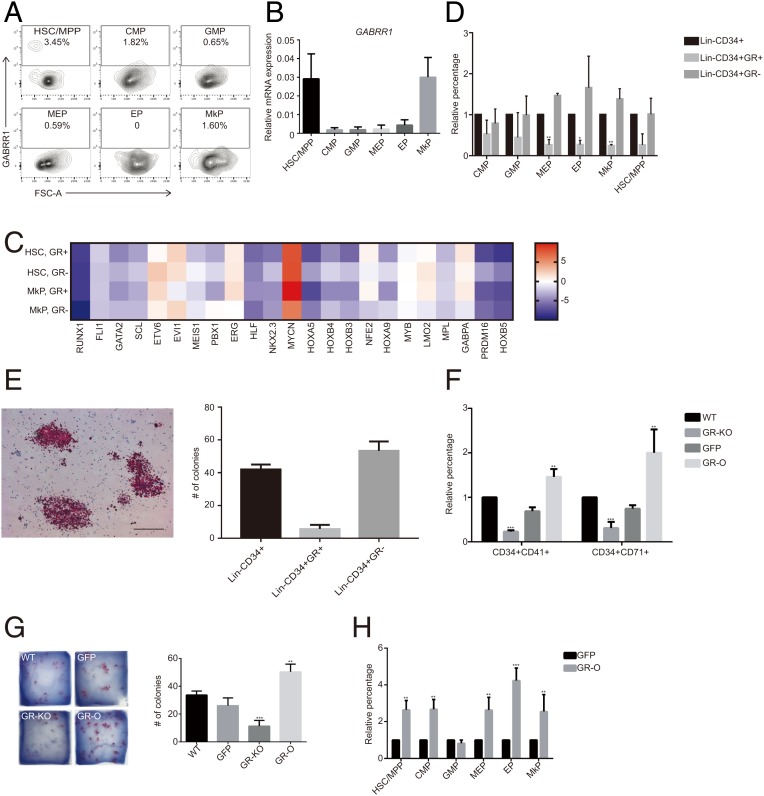
GABRR1 expression and the consequence of GABRR1 ablation or overexpression in the human hematopoietic system. (A) GABRR1 expression analysis in human HSPCs from bone marrow by multicolor flow cytometry. Numbers represent the percentage of GABRR1+ cells. (B) Expression of GABRR1 in human HSPC populations by real-time PCR analysis. Data shown are mean ± SD. (C) The HSC- and MkP-associated genes were analyzed in purified GR+ HSCs, GR− HSCs, GR+ MkPs, and GR− MkPs by real-time PCR. (D) Flow cytometry analysis of the HSPC subpopulations after differentiation in vitro from human Lin-CD34+, Lin-CD34+GR+, and Lin-CD34+GR− cells. (E) CFU-MK colonies generated from Lin-CD34+, Lin-CD34+GR+, or Lin-CD34+GR− cells. (Scale bar, 100 uM.) (F) The changes of CD34+CD41+ cells (MkP) and CD34+CD71+ cells (EP) after 7 d of differentiation from purified CD34+ cells with GABRR1 knockout or overexpression. The percentage of each HSPC population from the nontreated WT cells was set to 1, and the percentage from other treatments was normalized to that. (G) CFU-MK colonies generated from CD34+ bone marrow cells with GABRR1 knockout or overexpression. GR-KO, GABRR1 knockout; GR-O, GABRR1 overexpression. (H) Quantification of human HSPC subpopulation changes by multicolor flow cytometry after 7 d of differentiation from bone marrow CD34+ cells with GABRR1 overexpression. The percentage of each HSPC population from the nontreated cells was set to 1, and the percentage from GABRR1-overexpressing cells was normalized to that. Data shown are representative of at least 3 independent experiments. Error bars indicate SD. *P < 0.05, **P < 0.01, ***P < 0.001.

