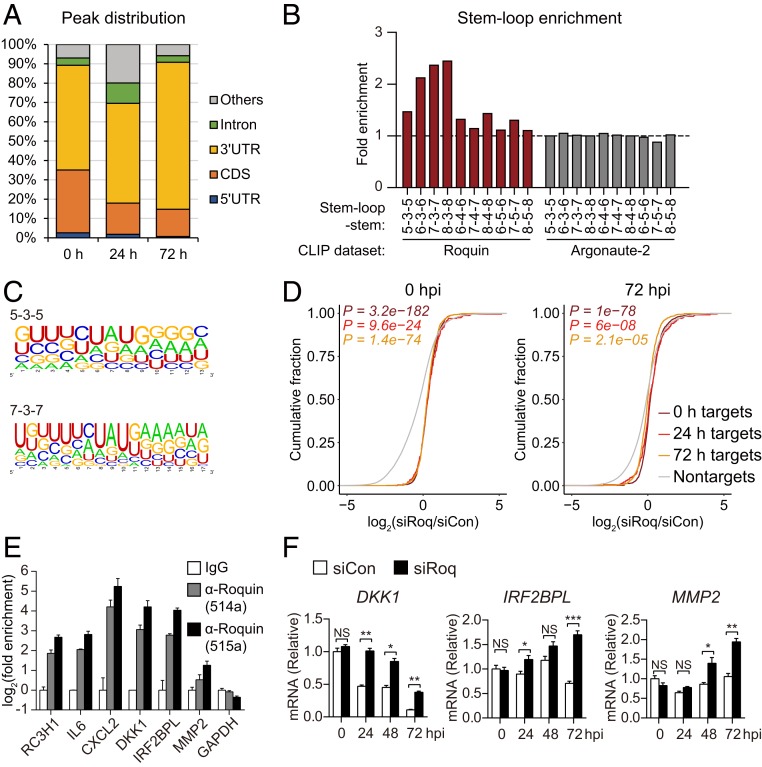
Fig. 4.
Genome-wide identification of Roquin target genes. (A) Distribution of binding sites among RNA transcripts based on overlapped Roquin-binding clusters. (B) Enrichment of indicated stem-loop structures in the Roquin-binding clusters as compared with 100 dinucleotide shuffles of each sequence. (C) RNA sequences of Roquin-binding clusters comprising each indicated stem-loop structure. (D) Cumulative-distribution function plot of fold changes in CLIP target genes identified at each time point and following Roquin silencing. P values were calculated using a two-sided Mann–Whitney U test. (E) Roquin binding of the indicated mRNAs according to RNA IP. (F) RNA levels of CLIP target genes measured in Roquin-silenced cells by qRT-PCR. (E and F) Data represent mean ± SEM, n = 3; *P < 0.05; **P < 0 .01; ***P < 0 .001 according to two-tailed Student’s t test; NS, not significant.

