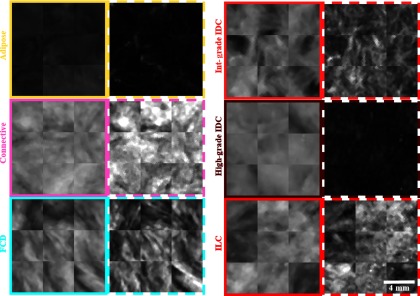
Fig. 2.
Representative samples of the normal and benign tissues (left column) and malignant tissues (right column). Panes are color-coded by tissue subtype. Solid boarders denote planar, diffuse illumination (, ) reflectance. Dashed boarders denote subdiffuse illumination (, ) reflectance. Scalebar is shown in the bottom-right corner.

