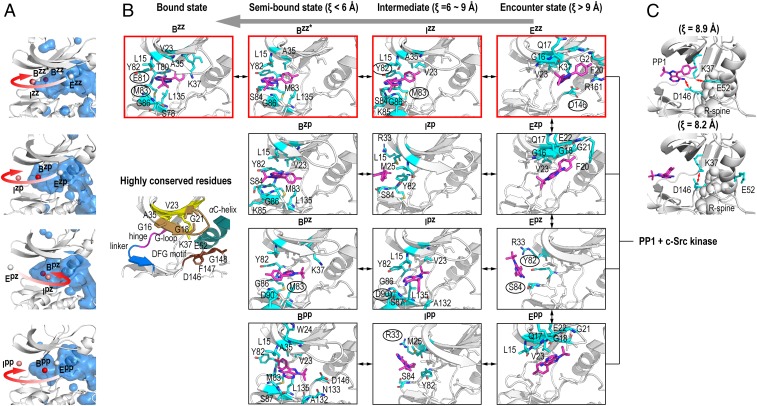
Fig. 4.
Parallel binding modes of PP1-Src. (A) Position of the COM of PP1 in each state for different pathways. The binding site cavity is shown in blue. (B) Representative structures in each state obtained from the k-means clustering analysis for each binding pathway. Residues within 4 Å from PP1 are highlighted in cyan. The residues interacting with PP1, as obtained from LIGPLOT analysis, are labeled (plane for hydrophobic and circled for hydrogen bonded interactions). The major pathway leading to the canonical pose (Ezz → Bzz) is highlighted with the red border. Highly conserved residues in the binding pocket (8) are shown (Left Middle). (C) Two representative structures in the transition state region (ξ = 8 Å ∼ 9 Å) along the main pathway (Ezz → Bzz) obtained from the k-means clustering analysis.

