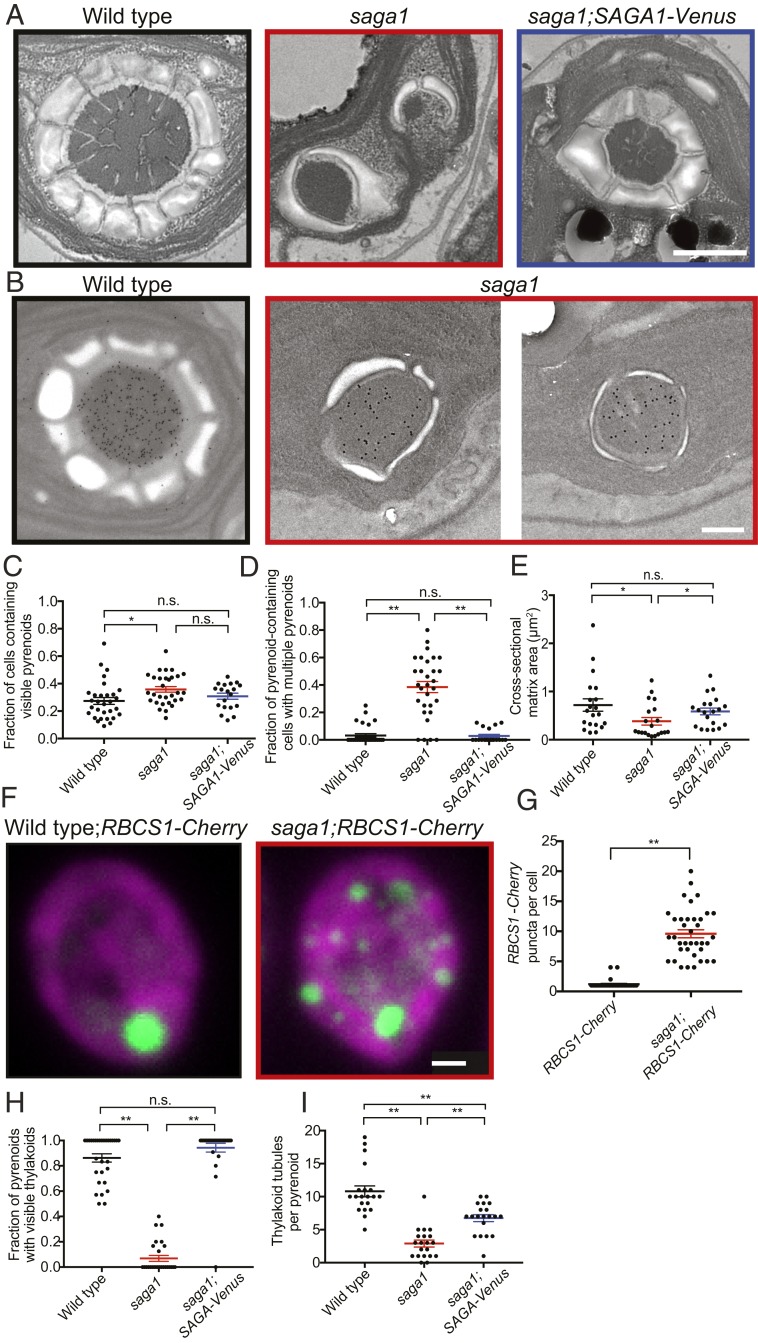
Fig. 3.
saga1 mutant cells have multiple pyrenoids and often lack thylakoid tubules. (A) Representative TEMs of wild-type, saga1, and saga1;SAGA1-Venus cells grown at low CO2, illustrating the frequent observation of multiple pyrenoids in saga1. (Scale bar, 500 nm.) (B) Representative immunogold staining images of wild type and saga1 pyrenoids using an anti-Rubisco antibody. (Scale bar, 500 nm.) (C) The fraction of cells containing visible pyrenoids in wild-type, saga1, and saga1;SAGA1-Venus cells grown at low CO2 (n = 30 fields of view; Mann–Whitney U test). (D) The fraction of pyrenoid-containing cells that contain more than 1 pyrenoid in wild-type, saga1, and saga1;SAGA1-Venus cells grown at low CO2 (n = 30 fields of view; Mann–Whitney U test). (E) Pyrenoid matrix cross-sectional area in wild-type, saga1, and saga1;SAGA1-Venus cells grown at low CO2 (n = 20 pyrenoids). (F) Representative summed z-stacks of wild-type and saga1 cells constitutively expressing RBCS1-mCherry (green) grown in low CO2. Magenta is chlorophyll autofluorescence. (Scale bar, 1 μm.) (G) Quantification of the number of RBCS1-mCherry puncta per cell (wild type: 1.2 ± 0.7 puncta per cell; saga1: 9.6 ± 4.1; n = 35 cells, Mann–Whitney U test). (H) Quantification of the fraction of pyrenoids with visible thylakoid tubules (n = 30 fields of view; Mann–Whitney U test). (I) The number of thylakoid tubules per pyrenoid in wild-type, saga1, and saga1;SAGA1-Venus cells grown at low CO2 (n = 20 pyrenoids, Mann–Whitney U test). Error bars: SEM; n.s., not significant; P ≥ 0.05; *P < 0.05; **P < 0.001.

