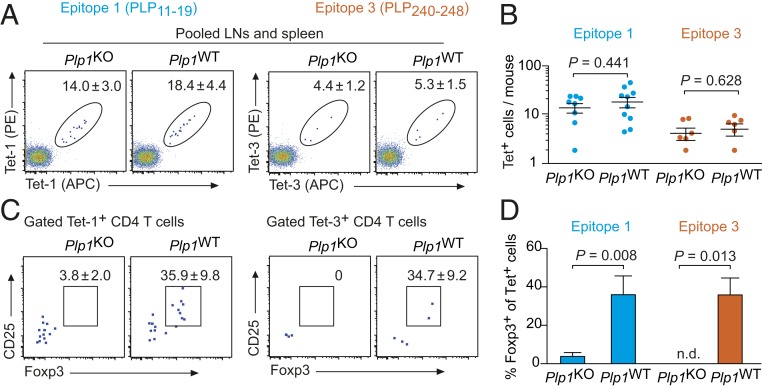
Fig. 1.
PLP-specific peripheral CD4 T cells in Plp1KO or Plp1WT mice. (A) Analysis of pooled spleen and lymph node cells after enrichment of PLP11–19– or PLP240–248−specific CD4 T cells. Dot plots are gated on CD4+CD8−Dump− cells (SI Appendix, Fig. S1). The calculated mean number ± SEM of tetramer-positive cells/mouse is indicated (n ≥ 6 each). (B) Number of PLP11–19– or PLP240–248–specific CD4 T cells/mouse. Each data point represents an individual mouse. (C) Foxp3GFP and CD25 expression in peripheral tetramer-positive cells. Numbers indicate the mean frequency ± SEM of Foxp3+CD25+ cells (n ≥ 6 each). (D) Summary of data in C.

