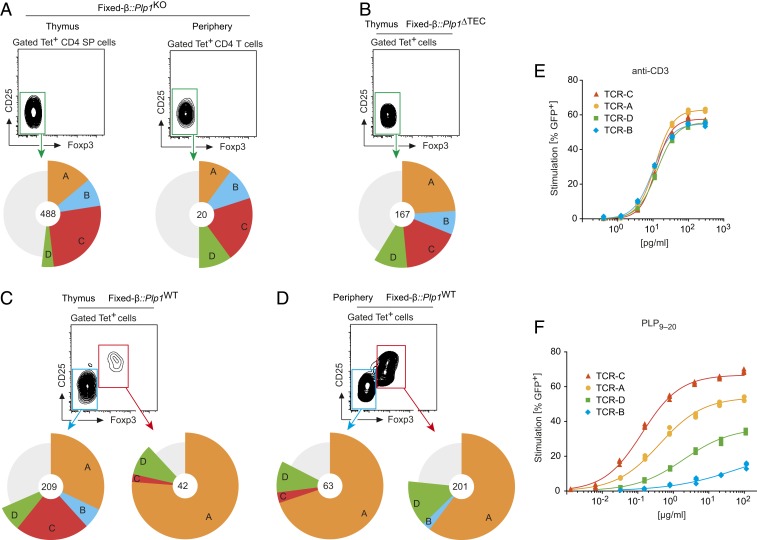
Fig. 5.
TCR inventories of PLP11–19–specific CD4 T cells from thymus or periphery of Plp1KO and Plp1WT mice expressing a fixed TCRβ chain. (A) Frequency of the 4 public TCRs A, B, C, and D in thymic or peripheral Tet-1+ T cells of Fixed-β::Plp1KO mice. The gray sector comprises all other TCR entities that were found at a frequency of >1%. Numbers in the center indicate the total number of cells that are represented in the respective pie chart. The graphs summarize data obtained from single cells from 111 mice analyzed in multiple pools. (B) Frequency of the TCRs A, B, C, and D in the thymic Tet-1+ CD4 SP cell population of Fixed-β::Plp1ΔTEC mice. Summary of data obtained from sorted single cells from 47 mice. (C) Frequency of the TCRs A, B, C, and D in Foxp3− or Foxp3+ Tet-1+ CD4 SP thymocytes from Fixed-β::Plp1WT mice. Summary of data obtained from sorted single cells from 114 mice. (D) Frequency of the TCRs in peripheral Foxp3− or Foxp3+ Tet-1+ CD4 T cells from Fixed-β::Plp1WT mice. Summary of cumulative data from sorted single cells from 132 mice. (E) Dose–response of CD4 T cell hybridoma cells expressing TCRs A, B, C, and D to stimulation with titrated amounts of anti-CD3 antibody. (F) Dose–response of CD4 T cell hybridoma cells expressing TCRs A, B, C, and D to stimulation with titrated amounts of cognate antigen. Data in E and F are representative of at least 3 experiments.

