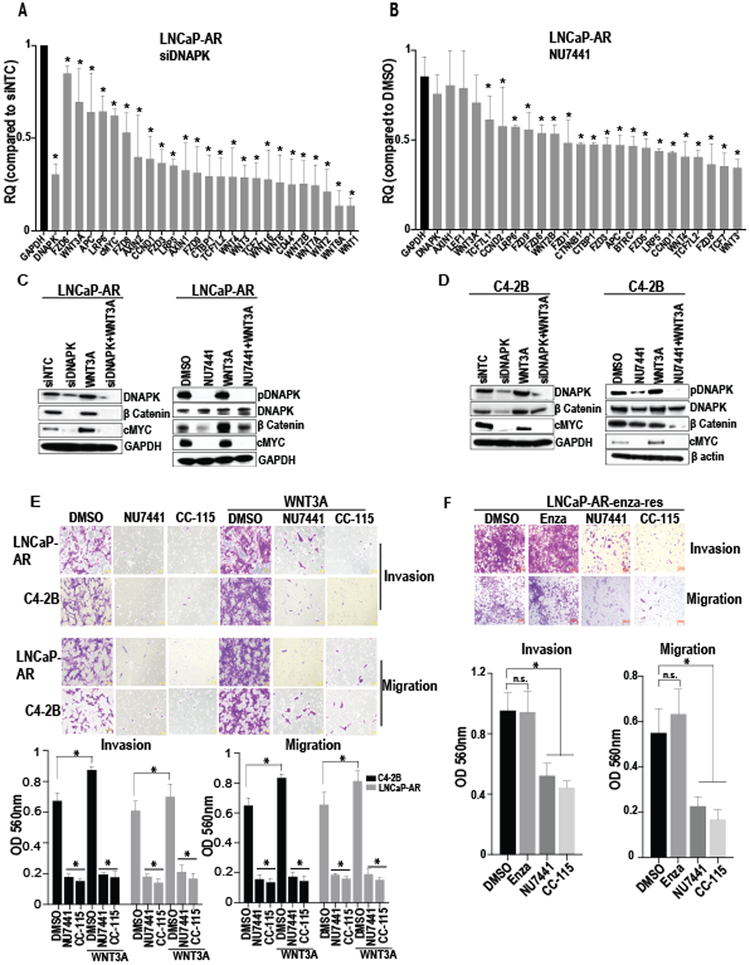
Figure 4. DNAPK inhibition reduces Wnt signaling in CRPC cells.
(A and B), Bar graphs show the expression of Wnt pathway genes after knockdown (via siRNA) or inhibition (via NU7441, 1 μM) of DNAPK in LNCaP-AR cells (N=2, in duplicates). (C and D), Immunoblot analyses show the effect of DNAPK knockdown (via siRNA) or inhibition (via NU7441 1 μM) on indicated proteins in LNCaP-AR and C4-2B cells. E, Representative images (magnification 20X) demonstrate the effect of DNAPK inhibition (via NU7441 or the clinical-grade DNAPK inhibitor CC-115, 1 μM) on invasion and migration of LNCaP-AR and C4-2B cells (N=3 in duplicates). Recombinant human WNT3A (200 ng/ml) was used to stimulate Wnt signaling (C-E). Bar graphs represent the quantification of invaded/migrated cells. F, Images (magnification 20X) display the effect of DNAPK inhibition (via NU7441 or CC-115) on invasion and migration of enzalutamide resistant LNCaP-AR (LNCaP-AR-enza-res) cells. Bar graphs show quantification of invaded/migrated cells. All data are represented as mean ± SEM *= p < 0.05 compared to respective controls and were calculated using two-way ANOVA (Figure 4A, 4B, 4E) or one way AVOVA (Figure 4F). Graphs and statistical analyses were done on GraphPad Prism software. RQ = relative quantity.

