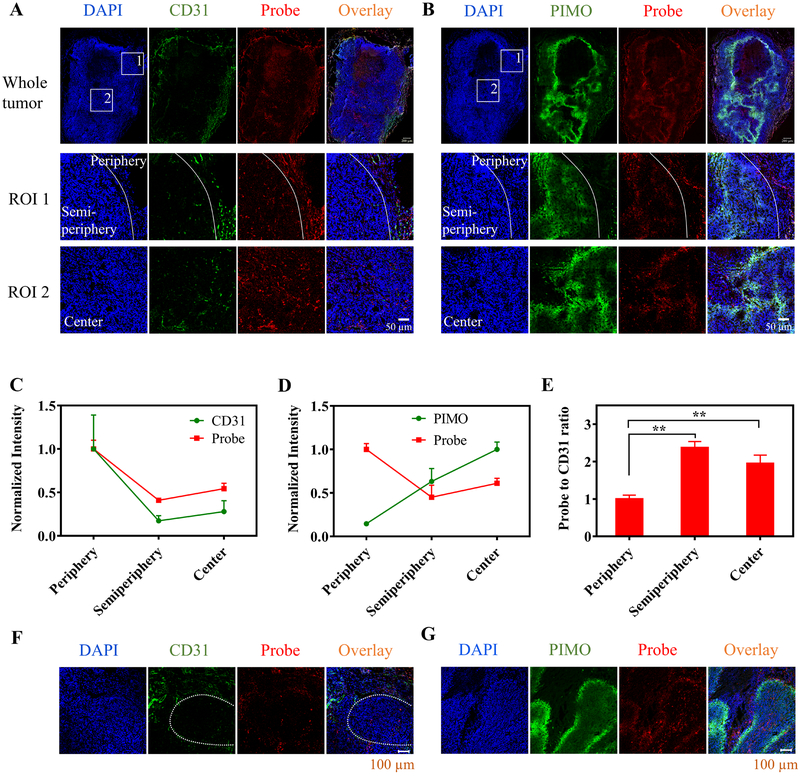
Figure 2.
Intratumor distribution of the nanoprobe after i.v. injection. A,B, Nude mice bearing HeLa tumor were i.v. injected with the nanoprobe (2 mg/kg) and the tumor tissues were collected at 24 h p.i. The frozen sections of the tumor tissues were stained with (A) CD31 antibody and (B) pimonidazole (PIMO) antibody (green). The nanoprobe was observed by collecting its 685 nm emission (red) and nuclei of cells were stained with DAPI (blue). Two regions of interest (ROIs) in the whole tumor sections were selected and enlarged in bottom two rows (white boxes). ROI 1 contained two regions as divided by the white line: the tumor periphery on the right side and semi-periphery (0–400 μm to the periphery) on the left side; ROI 2 was in the center of the tumor. Scale bars: 200 μm for whole tumor and 50 μm for the ROIs. C,D,E, The probe distribution in three different regions of the tumor tissues (periphery, semi-periphery, and center) is compared to levels of (C) vascular density (CD31 staining intensity per area) or (D) hypoxia (PIMO staining intensity per area). The signal intensities per area of the probe, CD31 and PIMO in various regions were normalized by the average probe signal intensity per area in the periphery, average CD31 staining intensity per area in the periphery, and average PIMO staining intensity per area in the center, respectively. E, The ratios of probe concentration to vascular density in the three different regions were compared. Results are presented as Mean ± SD (N = 3). ** p < 0.01, in comparison among the probe-to-CD31-ratio values of various tumor regions by one-way ANOVA with Geisser-Greenhouse correction. F,G, Penetration of the nanoprobes from the blood vessels to the hypoxic regions of the tumor tissue. The hypoxic regions were determined by (F) low vascular density or (G) PIMO staining. The white dashed line in F indicates a hypoxic region.

