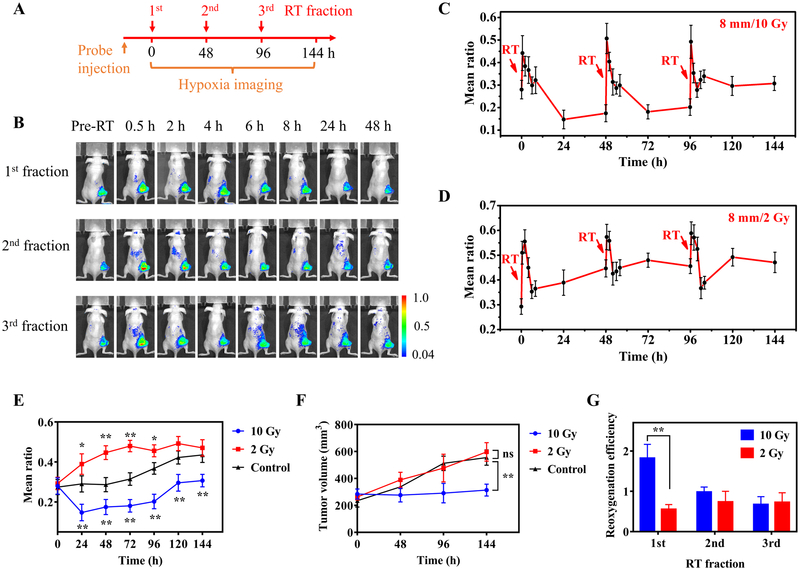
Figure 4.
Real-time monitoring tumor hypoxia dynamics in fractionated RT. A, Timeline of the experiment. Tumor-bearing mice were treated with three RT fractions with a 48 h interval. The nanoprobe was i.v. injected to the mice (2 mg/kg) at 24 h before the first RT fraction. Tumor hypoxia was imaged before RT and at 0.5 to 48 h after each RT fraction. B, Ratiometric images of a mouse bearing a HeLa tumor (8 mm) at indicated time points during three RT fractions (10 Gy per fraction). C,D, Evolution of the mean ratio over time when HeLa tumors (8 mm) were treated with three RT fractions (C: 10 Gy; D: 2 Gy per fraction; N = 3 per group). E, Long-term evolution of tumor hypoxia measured with a 24 h interval in HeLa tumors (8 mm) received indicated RT doses (10, 2, and 0 Gy as control). Results are presented as Mean ± SD (N = 3). * p < 0.05, ** p < 0.01, when comparing the mean ratio values of the RT-treated groups with those of the control group at various time points by one-way ANOVA with Geisser-Greenhouse correction. F, Tumor growth curves of HeLa tumors (8 mm) treated with different RT doses (10, 2 and 0 Gy as control). ** p < 0.01, ‘ns’ (not significant) p > 0.05, when comparing the tumor volumes of the RT-treated groups with those of the control group at 144 h time point by one-way ANOVA with Geisser-Greenhouse correction. G, Reoxygenation efficiency, defined by the ratio of hypoxia decrease in 0.5–24 h (the difference between the mean ratio at 0.5 h and 24 h) to hypoxia increase in 0–0.5 h after each RT fraction (the difference between the mean ratio between 0.5 h and pre-RT) of HeLa tumors for each RT fraction at different RT doses. Results are presented as Mean ± SD (N = 3). ** p < 0.01, in comparison between the reoxygenation efficiencies under different RT doses in the 1st RT fraction by two-tailed t-test with Welch’s correction.

