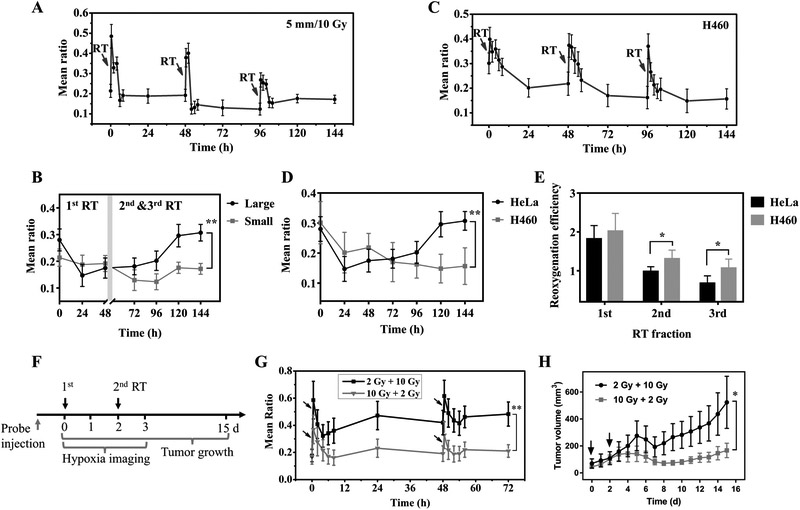
Figure 5 ∣.
Tumor hypoxia dynamics in RT at different tumor size/type and the effect of the first fraction dose on tumor hypoxia dynamics and treatment outcome. A,C, Evolution of tumor hypoxia over time when nude mice bearing (A) HeLa tumor (5 mm) or (C) H460 tumor (8 mm) were treated with three RT fractions (10 Gy per fraction). B,D, Comparison of the long-term evolution of hypoxia of (B) HeLa tumors with indicated size (large: 8 mm; small: 5 mm) or (D) different tumor types (HeLa or H460) at the same tumor size (8 mm). Results are presented as Mean ± SD (N = 3). ** p < 0.01, in comparison between the mean ratio values at different (B) tumor sizes or (D) tumor types at 144 h time point by two-tailed t-test with Welch’s correction. E, The reoxygenation efficiency of HeLa and H460 tumors in each RT fraction. Results are presented as Mean ± SD (N = 3). * p < 0.05, in comparison between the reoxygenation efficiency of HeLa and H460 tumors in the 2nd and 3rd RT fraction by two-tailed t-test with Welch’s correction. F,G,H, The effect of first fraction dose on tumor hypoxia dynamics and treatment outcome. (F) Timeline of the experiment. Nude mice bearing H460 tumors were treated with two RT fractions at day 0 and day 2 (group 1: 2 Gy + 10 Gy, group 2: 10 Gy + 2 Gy, n = 10 per group). The nanoprobe was i.v. injected to the mice (2 mg/kg) at 24 h before the first RT fraction. (G) The evolution of tumor hypoxia was monitored from day 0 to day 3 and (H) the tumor growth was recorded from day 0 to day 15. The black arrows indicate RT treatment. * p < 0.05, ** p < 0.01, in comparison between the (G) mean ratio or (H) tumor volume of the two groups by two-tailed t-test with Welch’s correction.

