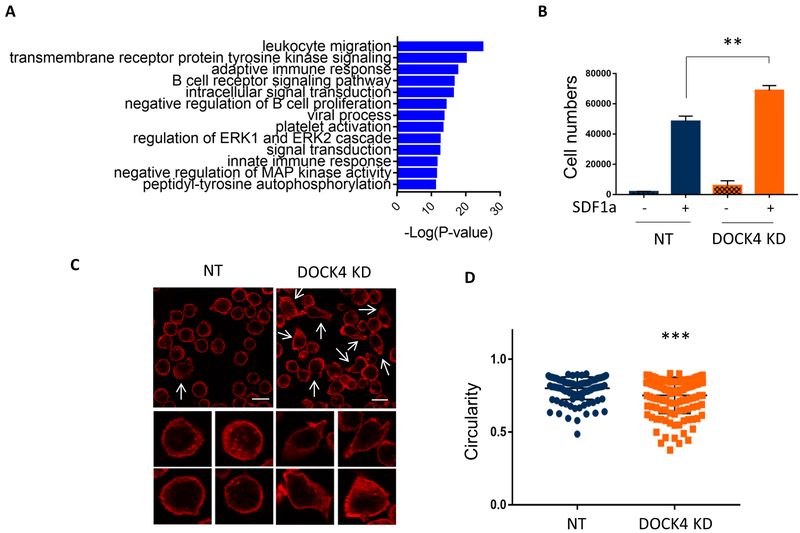
Figure 3: Reduced levels of DOCK4 leads to increased cell migration and cell morphology in HSCs.
A) Differentially phosphorylated proteins displayed in table 1 were used for in silico gene ontology pathway analysis to predict functional pathways associated with identified phosphoproteins. Predicted functional pathways are displayed graphically. B) Transwell cell migration assays performed to compare differences in cell mobility/migration in HSCs expressing normal and reduced levels of DOCK4. Data are represented as mean ±SEM from four biological replicates (**P < 0.005; Student’s t test.). C) Changes in HSC morphology following knockdown of DOCK4 was determined by staining for cytoskeletal F-actin and analyzed by immunofluorescence microscopy. Cells which depicted spread morphology with bundled actin at the leading edges are shown in white arrows (Scale bar, 15μM). Individual cells at high magnification showing pronounced cell spreading and bundled F-actin when DOCK4 levels were reduced. D) Cell shape/circularity was measured in HSCs expressing normal and reduced levels of DOCK4 using circularity parameter in Fiji image analysis software. A minimum of 100 cells from four random fields were quantified (***P < 0.0005; Student’s t test.). NT – Non-targeting control.

