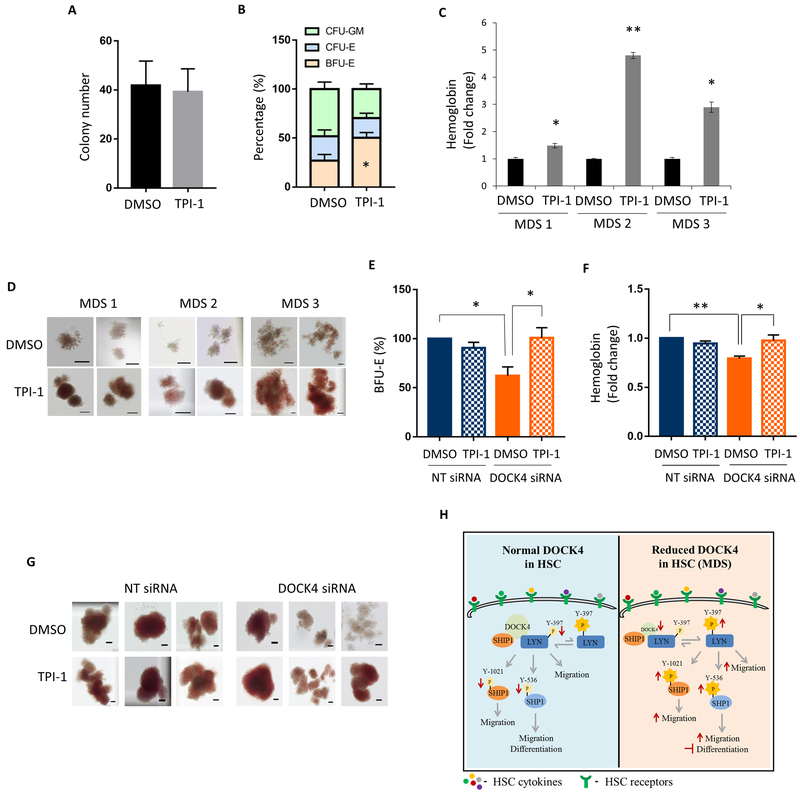
Figure 5: Inhibition of SHP1 activity promotes erythroid differentiation in DOCK4 deficient MDS.
CD34+ stem/progenitor cells were purified from −7/(del)7q MDS patients bone marrow mononucleated cells and methylcellulose colony assays were setup in the presence or absence of SHP1 inhibitor, TPI-1 (4μM). After 14–16 days of culture under differentiation conditions, A) Total number of colonies enumerated from each arm of the experiment. Data are mean ±SEM from seven different −7/(del)7q MDS patients. B) Scoring for early erythroid (BFU-E), late erythroid (CFU-E) and myeloid (CFU-GM) (*P < 0.05; Student’s t test.). Data are mean ±SEM from seven different −7/(del)7q MDS patients. C) ELISA performed to determine beta hemoglobin expression. Data are represented as mean ±SEM from three technical replicates (*P < 0.05; **P < 0.005; Student’s t test.). D) Photomicrographs depicting colony morphology and the extent of hemoglobin after 14–16 days in methylcellulose (Scale bar, 100μM). 24 hrs following DOCK4 knockdown in HSCs, methylcellulose colony assays were setup in the presence or absence of SHP1 inhibitor, TPI-1 (4μM). After 14–16 days of culture under erythroid differentiation conditions, E) Percentage of erythroid colonies enumerated from each arm of the experiment. Data are mean ±SEM from four biological replicates. (*P < 0.05; Student’s t test.). F) ELISA performed to determine hemoglobin expression. Data are representative of five biological replicates (*P < 0.05; ** P < 0.005; Student’s t test.). G) Photomicrographs depicting colony morphology and the extent of hemoglobin after 14–16 days in methylcellulose (Scale bar, 100μM). H) Schematic of the DOCK4 signaling pathway in HSCs.

