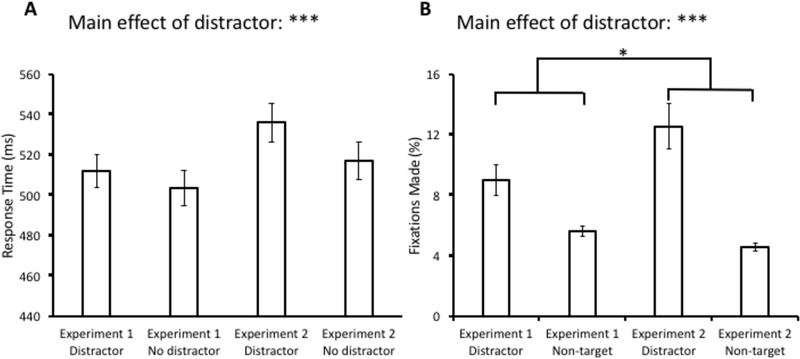
Fig 3.
Comparison of response time (A) and fixations (B) between the test phase of Experiment 1 (collapsed across shock and no-shock blocks) and Experiment 2. Data are broken down by experiment and distractor present vs. absent in (A) and fixations on the distractor vs. a non-target in (B). Error bars reflect the standard error of the mean. *p<0.05, ***p<0.001

