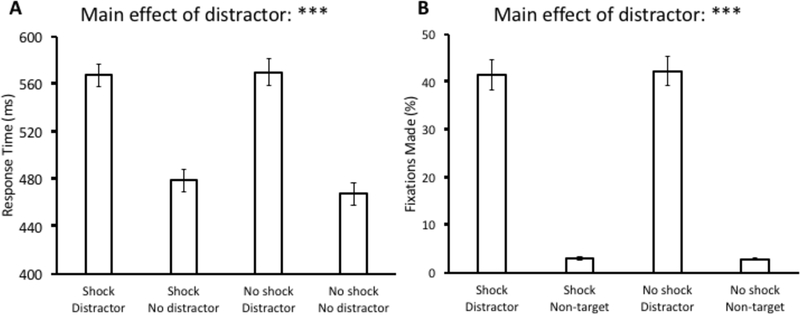
Fig 5.
Response time (A) and fixation data (B) from the test phase of Experiment 4. Data are broken down by block (Shock vs. No shock) and distractor present vs. absent in (A) and fixations on the distractor vs. a non-target in (B). Error bars reflect the standard error of the mean. ***p<0.001

