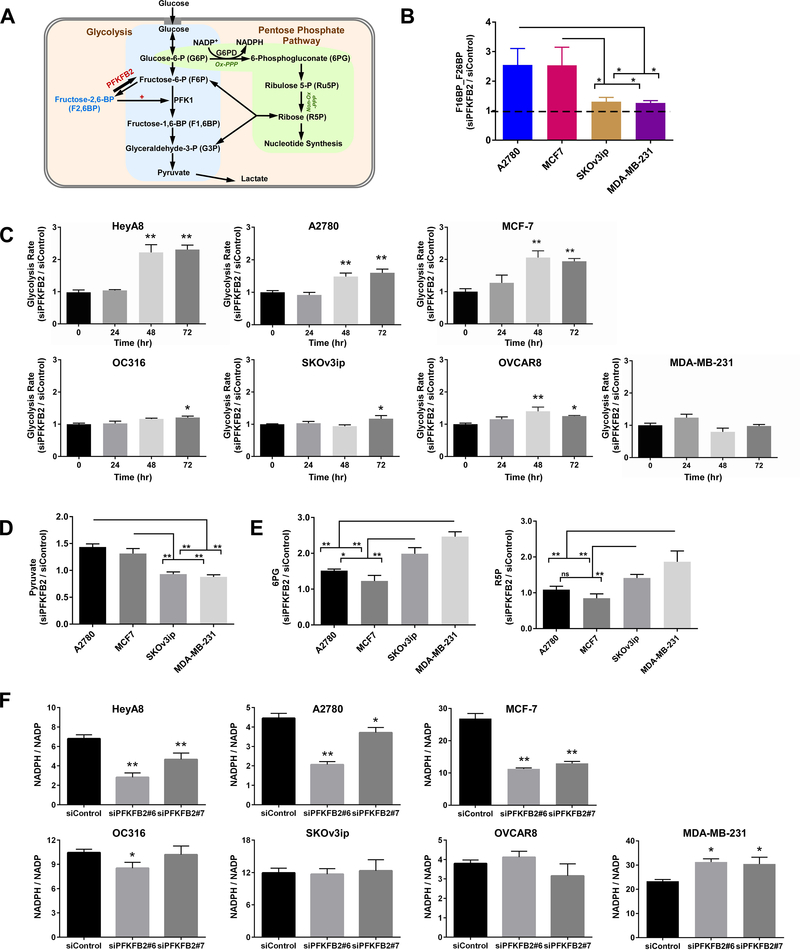
Figure 2. Identification of the mechanism(s) by which silencing PFKFB2 alters glycolysis and the pentose phosphate pathway (PPP).
(A) Working model demonstrating the regulation of glycolysis and pentose phosphate pathway by PFKFB2 in cancer cells. (B) Measurement of F1,6BP and F2,6BP. The concentrations of metabolites were measured by LC-MS in ovarian and breast cancer cell lines with or without depletion of PFKFB2. Cells were transfected with PFKFB2 siRNA for 28 hrs and then cell lysates were collected for the analysis. Because of technical limitations, we measured the mixture of F1,6BP and F2,6BP. The columns indicate the relative concentrations, and the bars indicate the S.D. (* p<0.05). Data were obtained from two independent experiments. (C) Measurement of glycolytic flux. The glycolytic flux was detected in 7 ovarian and breast cancer cell lines with or without depletion of PFKFB2 using a Seahorse glycolysis stress assay. The columns indicate the mean of lactate excretion, and the bars indicate the S.D. (* p<0.05 compared with “0” time point). Data were obtained from two independent experiments. (D and E) Measurement of pyruvate, 6PG and Ru5P. The concentrations of metabolites were measured by LC-MS in ovarian and breast cancer cell lines with or without depletion of PFKFB2. Cells were transfected with PFKFB2 siRNA for 28 hrs and then cell lysates were collected for analysis. The columns indicate the concentrations, and the bars indicate the S.D. (* p<0.05). Data were obtained from two independent experiments. (F) Determination of the ratios of NADPH/NADP+. NADPH and NADP+ were quantified with a Promega NADP/NADPH-Glo™ Kit in 7 ovarian and breast cancer cell lines with or without trasfection of siPFKFB2 for 48 hrs. The columns indicate the mean, and the bars indicate the S.D. (* p<0.05 compared with siControl). Data were obtained from two independent experiments.

