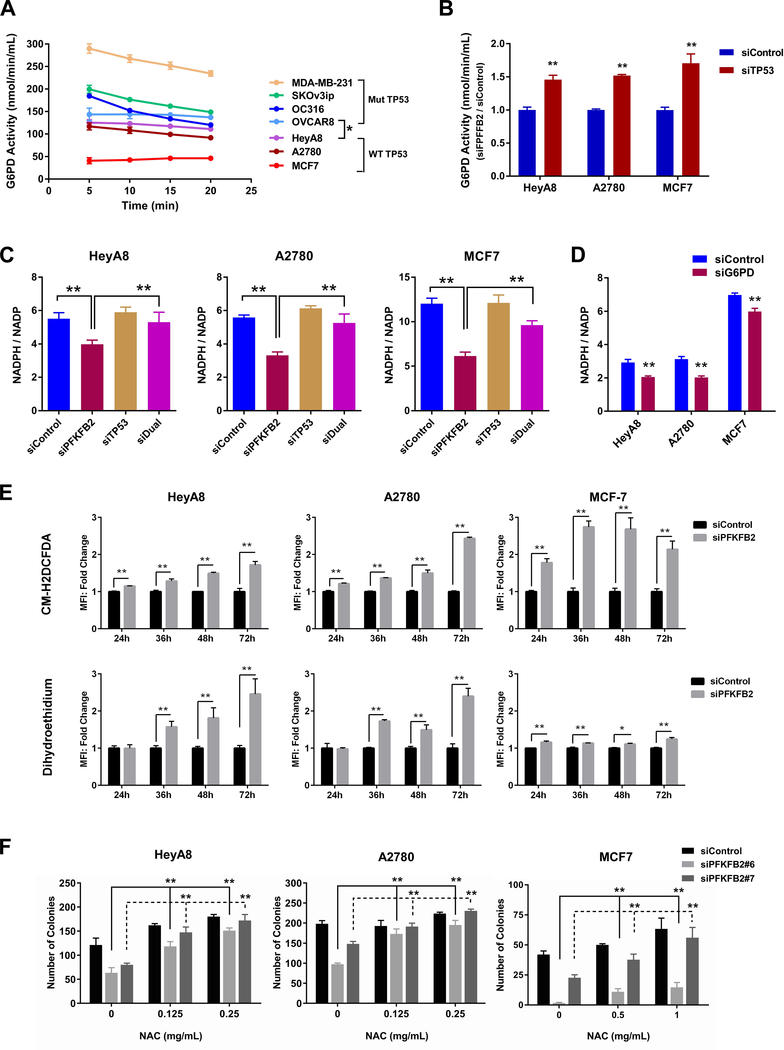
Figure 3. PFKFB2 promotes ovarian and breast cancer survival through a p53-dependent pathway.
(A and B) Measurement of G6PD in ovarian and breast cancer cells. The basal activity of G6PD (A) was measured at different incubation times. The enzymatic reaction was saturated after 20 mins. Each point represents the mean ± S. D. of product concentration (* p<0.05 compared to TP53 wild-type cell lines). G6PD Activity with or without TP53 siRNA was measured in (B) at 15-min incubation. (** p< 0.01 compared to siControl). Data were obtained from two independent experiments. (C and D) NADPH/NADP+ measurements were conducted in ovarian and breast cancer cells with PFKFB2 and/or TP53 siRNA (C) and with G6PD siRNA (D). Cells were transfected with targeting or control siRNA for 48 hrs prior to analyses. (E) Detection of ROS in ovarian and breast cancer cells. Cells were transfected with PFKFB2 siRNA for different time intervals as indicated, then cells were harvested and incubated with ROS detection dyes (CM-H2DCFDA and dihydroethidium). Cells were then washed prior to flow cytometric analysis. Mixture of siPFKFB2 #6 and #7 was used in this experiment. The columns indicate the fold change, and the bars indicate the S.D. (** p<0.01). Data were obtained from three independent experiments. (F) Clonogenic assays were conducted in ovarian (HeyA8 and A2780) and breast (MCF7) cancer cells with or without PFKFB2 siRNA in the absence or presence of the ROS inhibitor (NAC). Cells were transfected with PFKFB2 siRNA for 24 hrs, and then re-plated into 6-well plates with culture medium supplemented with increasing concentrations of NAC as indicated. The medium supplemented with NAC was refreshed daily. Cells were incubated for up to 14 days and viability was measured by colony counts. Data were obtained from three independent experiments. The columns indicate the mean of colony numbers, and the bars indicate the S.D. (** p<0.01).

