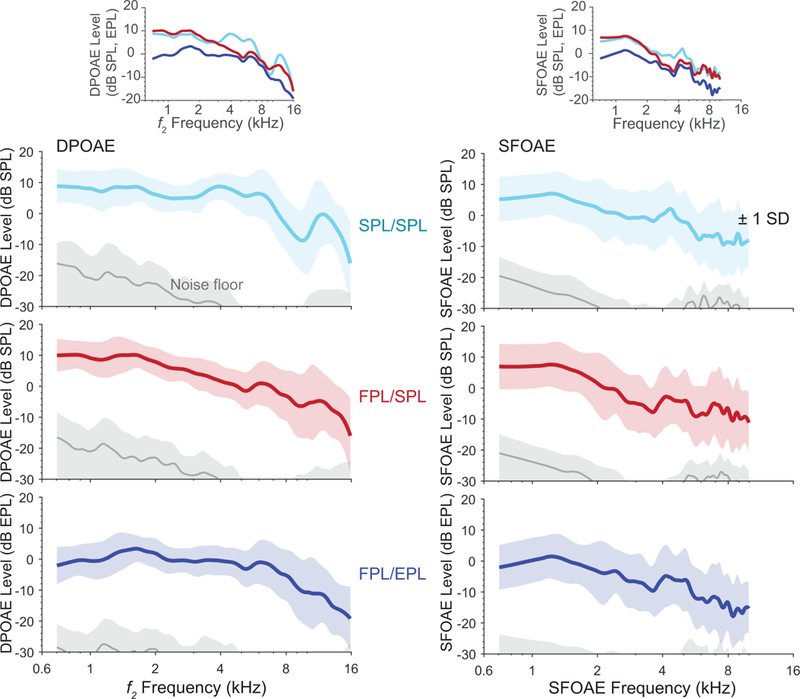
Figure 1.

Mean DPOAE and SFOAE levels (±1 SD – shaded regions) for three stimulus/response calibration methods (SPL/SPL, FPL/SPL, FPL/EPL) measured using moderate-level stimuli. The corresponding mean noise floor is shown in gray. The insets show OAE level superimposed for each condition to illustrate the impact of calibration method on OAE level.
