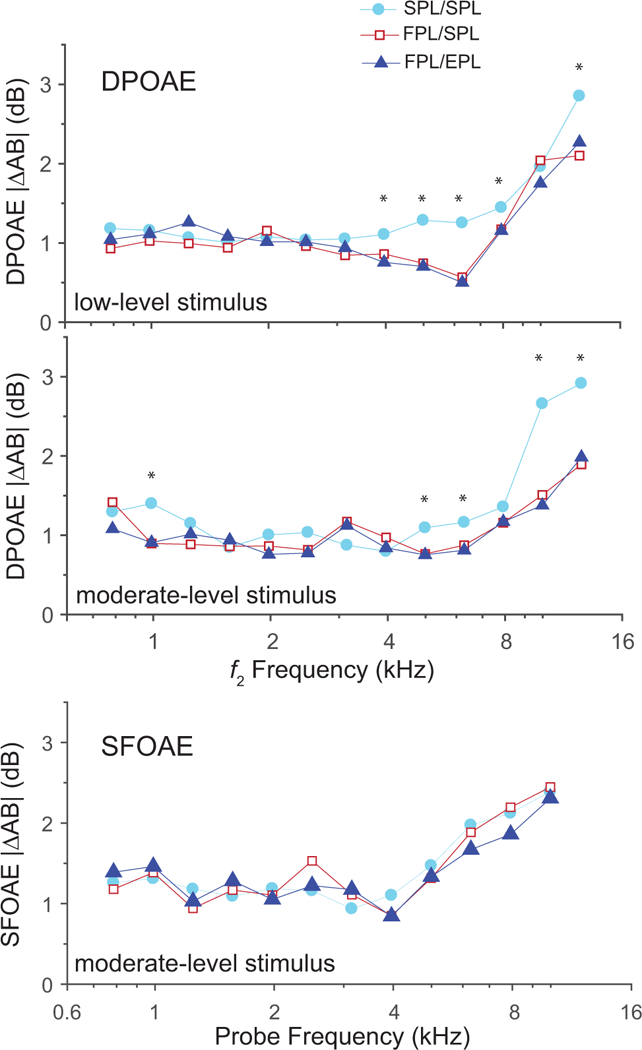
Figure 4.

Mean absolute differences |ΔAB{OAE}| between DPOAE levels (top and middle panels) and SFOAE levels (bottom panel) recorded during blocks A and B, averaged over one-third-octave frequency bands. The top and middle panels show DPOAE results obtained in the low- and the moderate-level stimulus conditions, respectively. Both the FPL/SPL and FPL/EPL calibration methods produced a significant improvement (i.e., smaller |ΔAB{DPOAE}|) over conventional SPL/SPL calibration for 5 frequencies in each panel (see asterisks), mostly for frequencies ≥ 4 kHz, where standing-wave interference is greatest. The bottom panel shows SFOAE results for the moderate-level stimulus. Although the results show no significant effect of calibration method on the SFOAE, the trends at frequencies ≥ 4 kHz are noteworthy and consistent with theory (see text).
