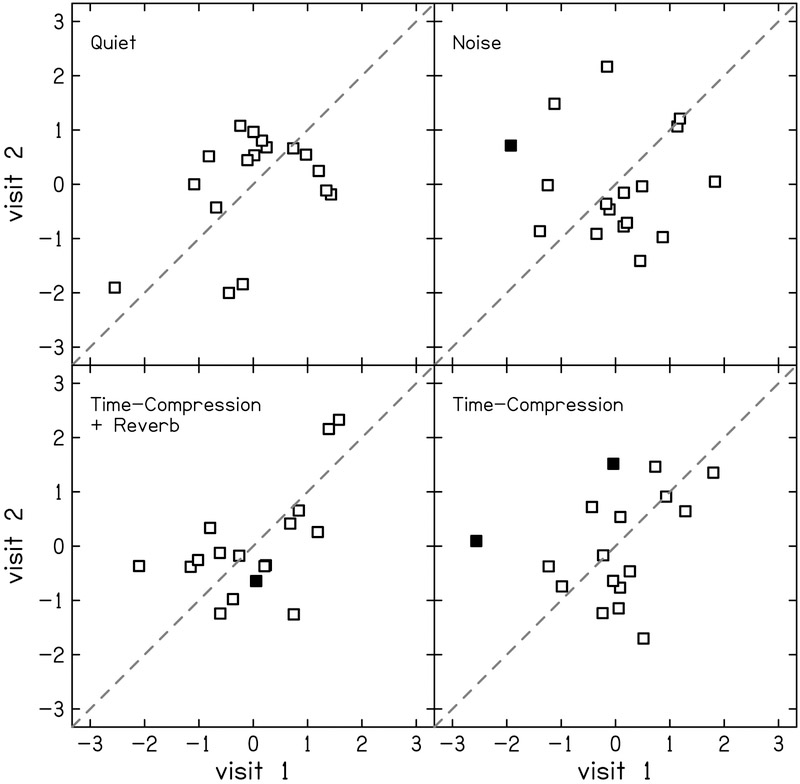
Figure 5.
Correlation between visits 1 and 2 for z-scores of word recognition residuals in four listening conditions: quiet (top-left), noise (top-right), time-compressed plus reverberation (bottom-left) and time-compressed alone (bottom-right). Filled squares indicate participants whose difference in score between visits was considered significant according to the 95% confidence intervals presented by Thornton & Raffin (1978). The dashed line indicates perfect reliability between visits.

