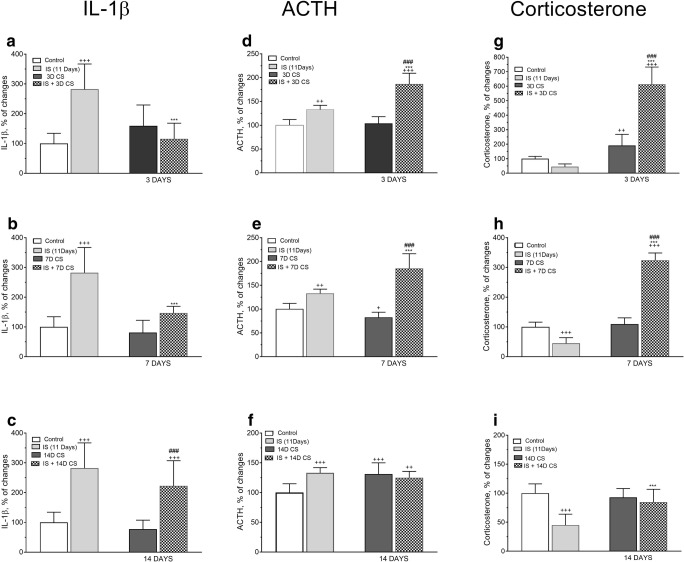
Fig. 12.
Comparison of the effect of isolation stress (IS) (for 11 days), crowding stress (CS) for 3 (a, d, g), 7 (b, e, h), and 14 days (c, f, i), and IS + CS (for 3, 7, and 14 days) on IL-1β (a, b, c), ACTH (d, e, f), and corticosterone levels (g, h, i) in plasma. Graphs represent the means ± SEM of 10–12 rats per group. Values are expressed as the mean ± SEM, n = 10–12 and were analyzed by two-way ANOVA and post hoc Tukey’s multiple comparison test: +p < 0.05, ++p < 0.01, +++p < 0.001 vs. non stressed control group; ***p < 0.001 vs. IS; ###p < 0.001 vs. CS

