
Fig. 5.
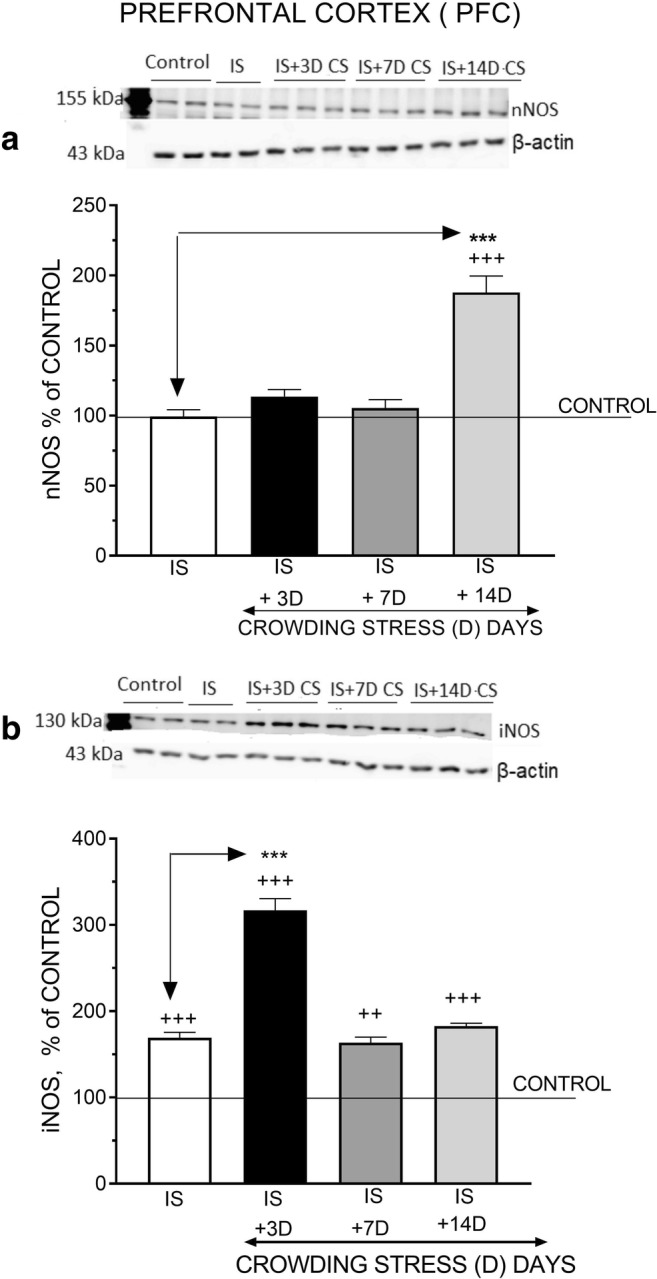
The effect of isolation stress (IS) for 11 days on subsequent crowding stress (CS) for 3, 7, and 14 days on nNOS (a) and iNOS (b) levels in the prefrontal cortex. Rats were exposed to isolation stress followed by crowding stress and decapitated. The panels above show representative immunoblots showing the expression of nNOS (a) and iNOS (b) in the prefrontal cortex. Graphs represent the means ± SEM of 10–12 rats per group. Data were assessed by one-way ANOVA followed by Newman’s test: ++p < 0.01 and +++p < 0.001 vs. non-stressed control group; ***p < 0.001 vs. isolation stress