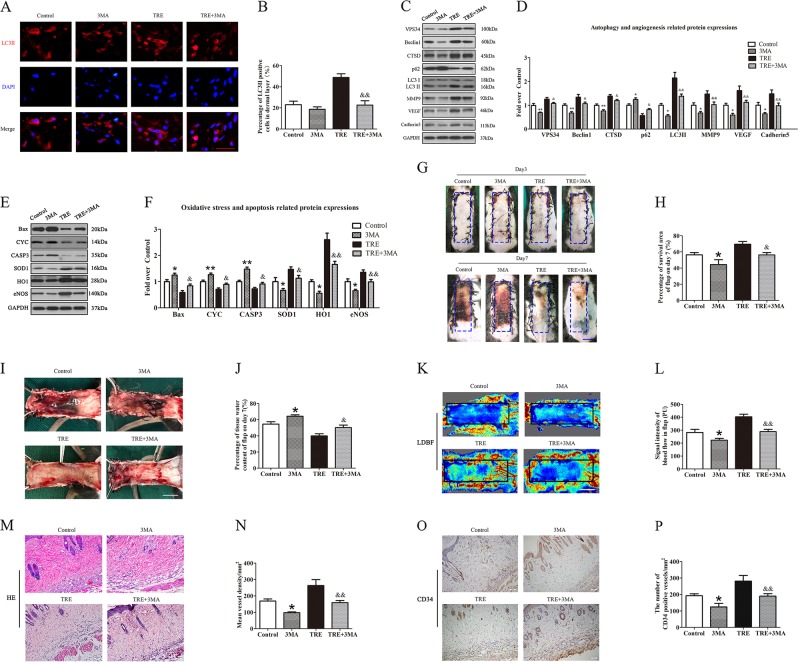
Fig. 6. Inhibition of autophagy reverses the effects of TRE on angiogenesis, apoptosis, oxidative stress and flap survival.
a Autophagosomes(red) in cells in Area II of flaps in the Control, 3MA, TRE and TRE+3MA groups by Immunofluorescence staining for LC3II (scale bar, 20 μm). b The percentages of LC3II positive cells in dermal layer were quantified and analyzed in each group. c, e The expressions of autophagy-related protein VPS34, Beclin1, CTSD, SQSTM1/p62, and LC3II; angiogenesis-related protein MMP9, VEGF, and Cadherin 5; apoptosis-related protein Bax, CYC, and CASP3 and oxidative stress-related protein SOD1, HO1, and eNOS in each group, were assessed by Western blotting. The gels have been run under the same experimental conditions, and cropped blots are used here. d, f Optical density values of VPS34, Beclin1, CTSD, SQSTM1/p62, LC3II, MMP9, VEGF, Cadherin 5, Bax, CYC, CASP3, SOD1, HO1, and eNOS expressions in each group. g Digital photographs of flaps of the Control, 3MA, TRE and TRE+3MA groups on POD 3 and POD 7 (scale bar, 1 cm). h The percentages of survival area in each group were quantified and analyzed. i Digital photographs of the inner side of flaps in the Control, 3MA, TRE and TRE+3MA groups on POD7 (scale bar, 1 cm). j Histogram of percentage of tissue water content in each group. k Full field LDBF images of flaps in each group on POD 7 (scale bar, 1 cm). l The signal intensity of blood flow of flaps was quantified and analyzed in each group. (m) H&E staining to show vessels in area II of flaps in the Control, 3MA, TRE and TRE+3MA groups (original magnifcation ×200; scale bar, 50 μm). n Histogram of percentage of MVDs in each group. o IHC for CD34 to present vessels of area II in the Control, 3MA, TRE and TRE+3MA groups (original magnifcation ×200; scale bar, 50 μm). p Histogram of percentage of CD34-positive vessels in each group. Values are expressed as means ± SEM, n = 6 per group. *p < 0.05 and **p < 0.01, vs. Control group; &p < 0.05 and &&p < 0.01, vs. TRE group

