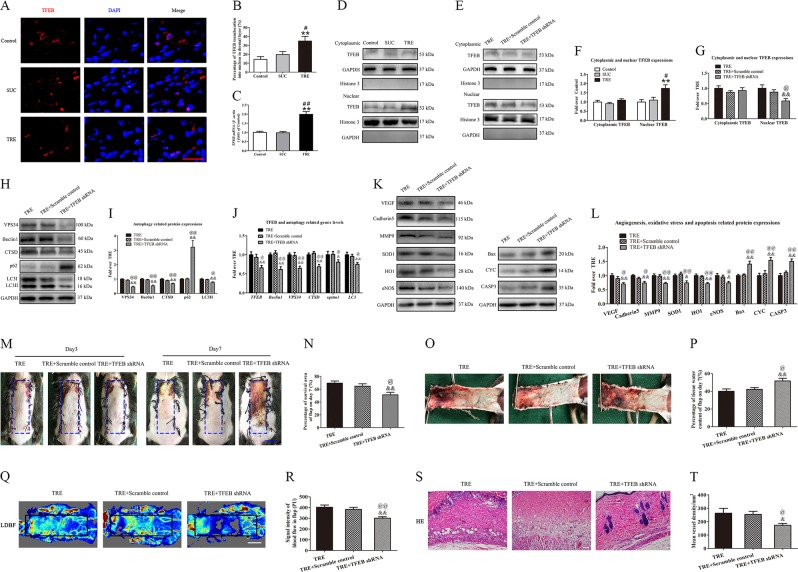
Fig. 7. TRE activates autophagy via enhancing TFEB activity.
a Nuclear translocation of TFEB (red) in cells of flaps in the Control, SUC and TRE groups by Immunofluorescence staining for TFEB (scale bar, 20 μm). b The percentages of TFEB translocation into nucleus in dermal layer were quantified and analyzed. c Transcripts of TFEB gene detected by real-time PCR. d and e The expressions of cytoplasmic TFEB, nuclear TFEB in the Control, SUC, TRE, TRE+Scramble control and TRE + TFEB shRNA groups as detected by Western blotting. The gels have been run under the same experimental conditions, and cropped blots are used here. f, g Optical density values of cytoplasmic TFEB and nuclear TFEB expressions in each group. h, i The expressions of VPS34, Beclin1, CTSD, SQSTM1/p62 and LC3II in the TRE, TRE+Scramble control and TRE+TFEB shRNA groups as assessed by Western blotting. And optical density values of these autophagy-related protein expressions in each group. j Transcripts of TFEB and its targeting genes, including Beclin1, VPS34, CTSD, SQSTM1/p62, and LC3 genes, were detected by real-time PCR. k, l The expressions of angiogenesis-related protein VEGF, Cadherin 5 and MMP9; oxidative stress-related protein SOD1, HO1, and eNOS and apoptosis-related protein Bax, CYC, and CASP3 in each group, were assessed by Western blotting. And optical density values of these protein expressions in each group. m Digital photographs of flaps of the TRE, TRE+Scramble control and TRE+TFEB shRNA groups on POD 3 and POD 7 (scale bar, 1 cm). n The percentages of survival area in the TRE, TRE+Scramble control and TRE+TFEB shRNA groups were quantified and analyzed. o Digital photographs of the inner side of flaps in the TRE, TRE+Scramble control and TRE+TFEB shRNA groups on POD7 (scale bar, 1 cm). p Histogram of percentage of tissue water content in each group. q Full field LDBF images of flaps in each group on POD 7 (scale bar, 1 cm). r The signal intensity of blood flow of flaps was quantified and analyzed in each group. s H&E staining to show vessels in area II of flaps in the TRE, TRE + Scramble control and TRE+TFEB shRNA groups (original magnifcation ×200; scale bar, 50 μm). t Histogram of percentage of MVDs in each group. Values are expressed as means ± SEM, n = 6 per group. *p < 0.05 and **p < 0.01, vs. Control group; #p < 0.05 and ##p < 0.01, vs. SUC group; &p < 0.05 and &&p < 0.01, vs. TRE group; @p < 0.05 and @@p < 0.01, vs. TRE + Scramble control group

