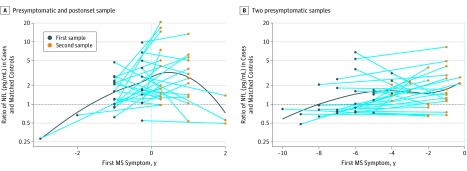
Figure 3. Ratio in Serum Neurofilament Light Chain (sNfL) Levels in Case Patients With Multiple Sclerosis (MS) and Matched Control Individuals According to Time to the First Clinical Symptoms.
The figure illustrates the relative difference (ratio) in sNfL levels in case patients with MS and their matched control individuals in a group with 1 presymptomatic and 1 postonset sample (A) and in a group with 2 presymptomatic samples (B). Each dot represents 1 case-control pair. A locally estimated scatterplot smoothing curve illustrates the changes in the ratio over time.

